韩国朋友真是太热情了。下面是这次分享的内容,文章后面我还会记录些这次首尔的见闻。

The topic I’ll be discussing is the evolution of iOS performance optimization. I hope you can take away some insights from my talk.
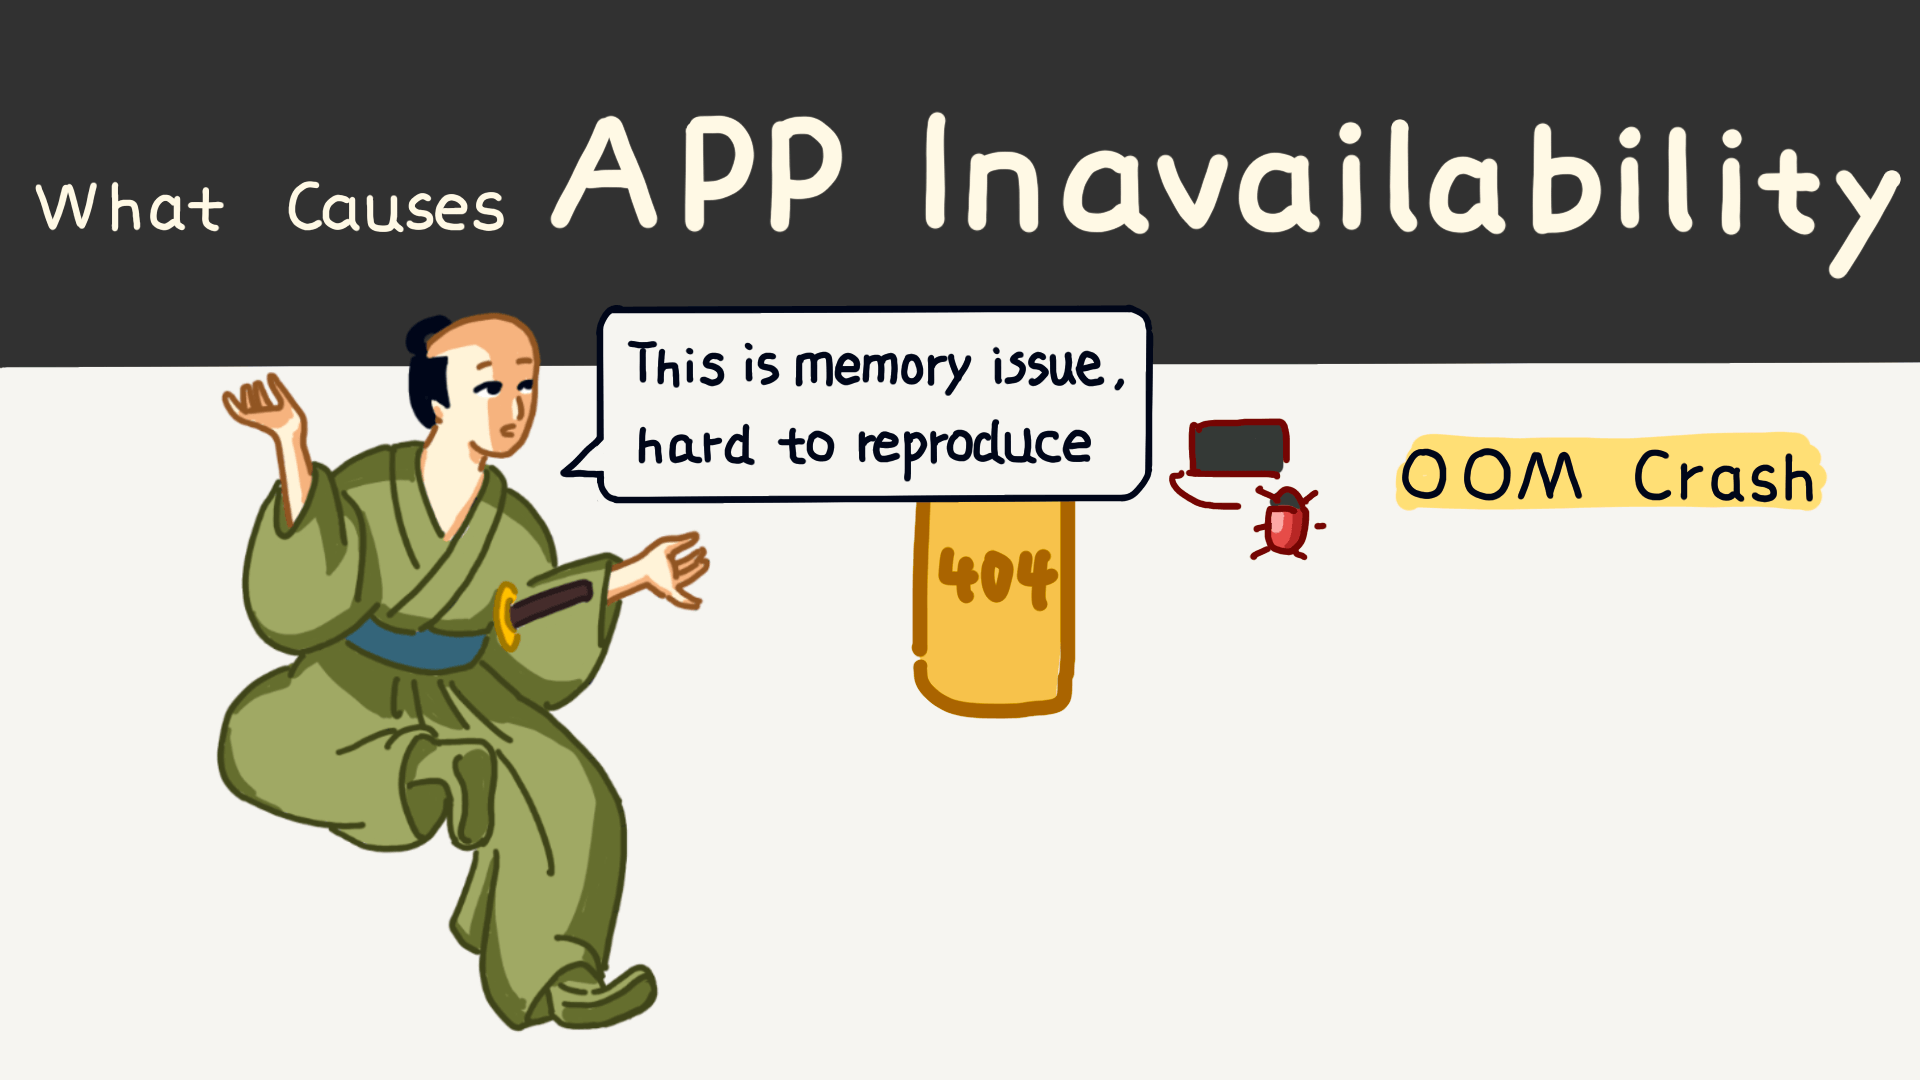
Let’s first talk about a few situations where an app becomes unusable, which can be simplified into app crashes or freezes. There are three main reasons, the first being OOM, meaning memory exhaustion.
When an app consumes too much memory, the system can no longer allocate more, leading to OOM. This issue doesn’t produce crash logs, making it tricky to trace.
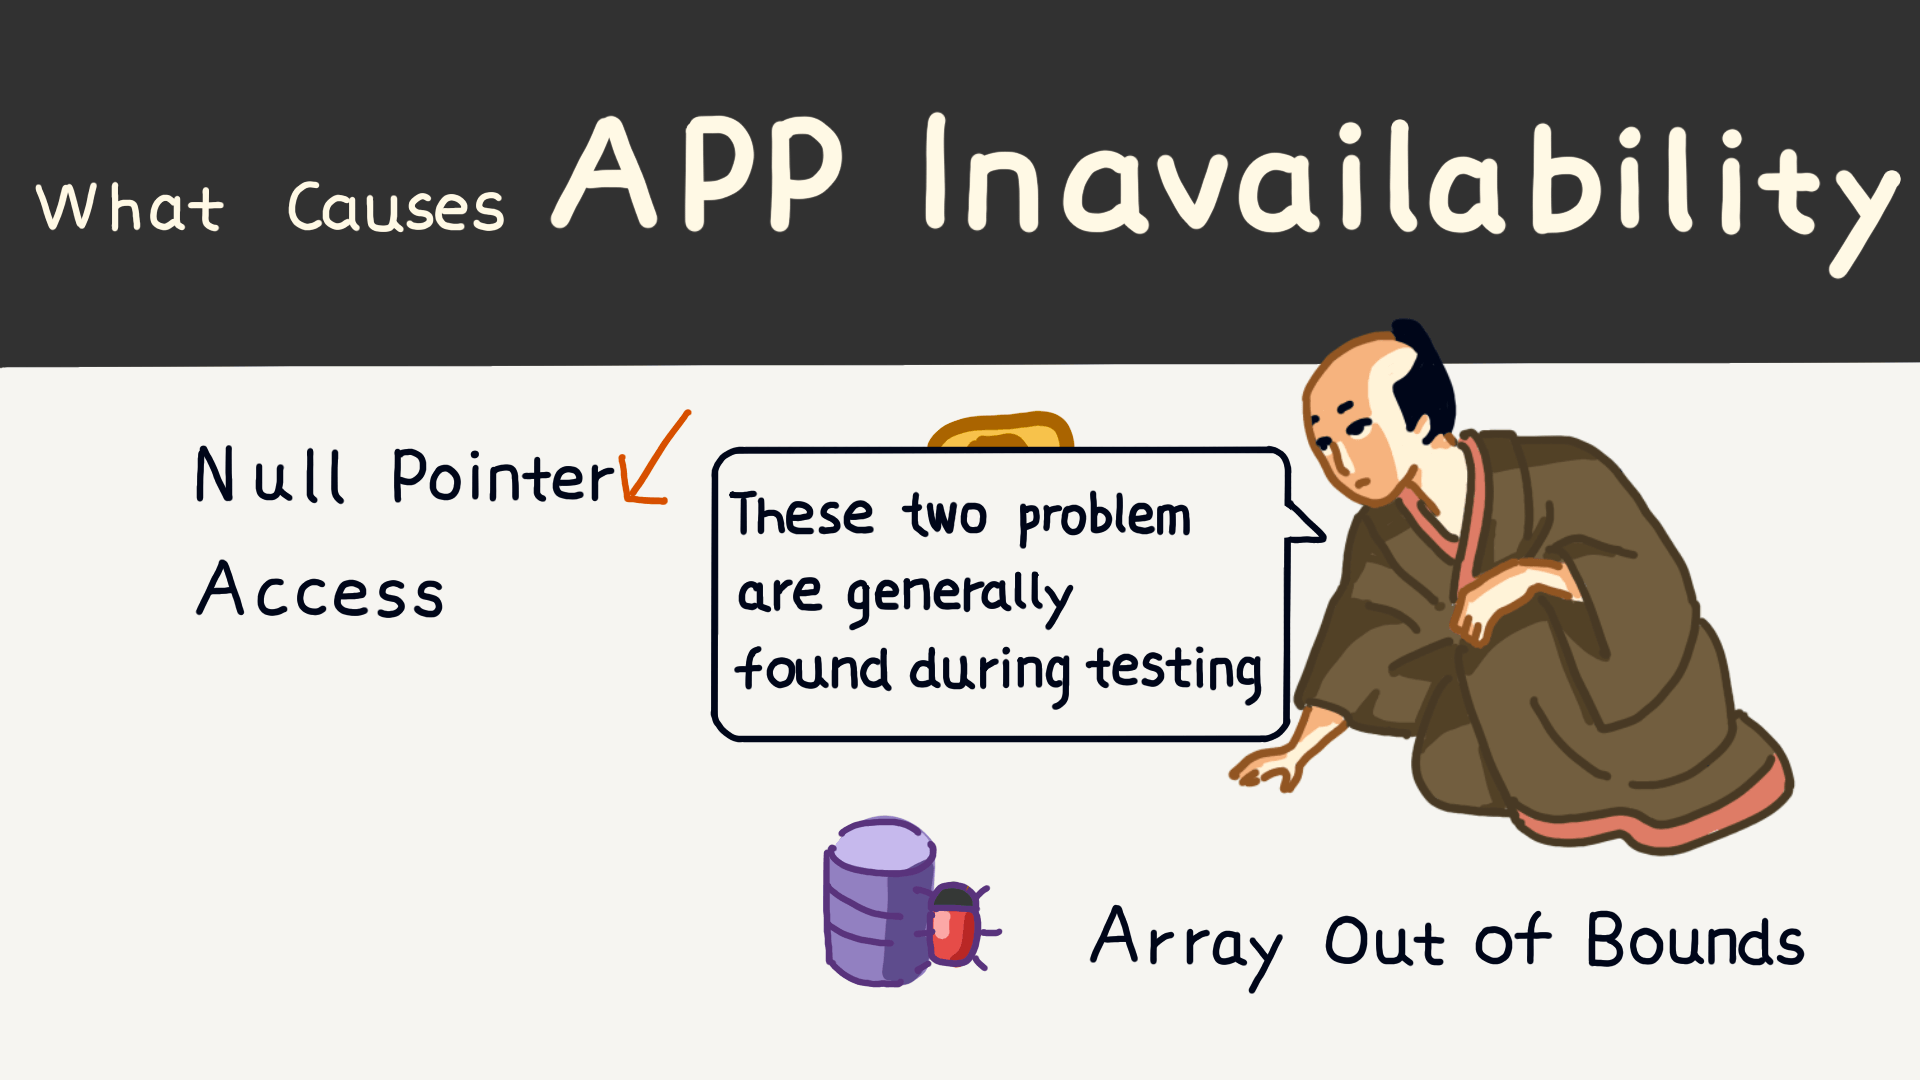
The second reason is a null pointer, where the pointer points to an invalid memory address. The third common issue is accessing a nil element in an array, which is another frequent cause of crashes.
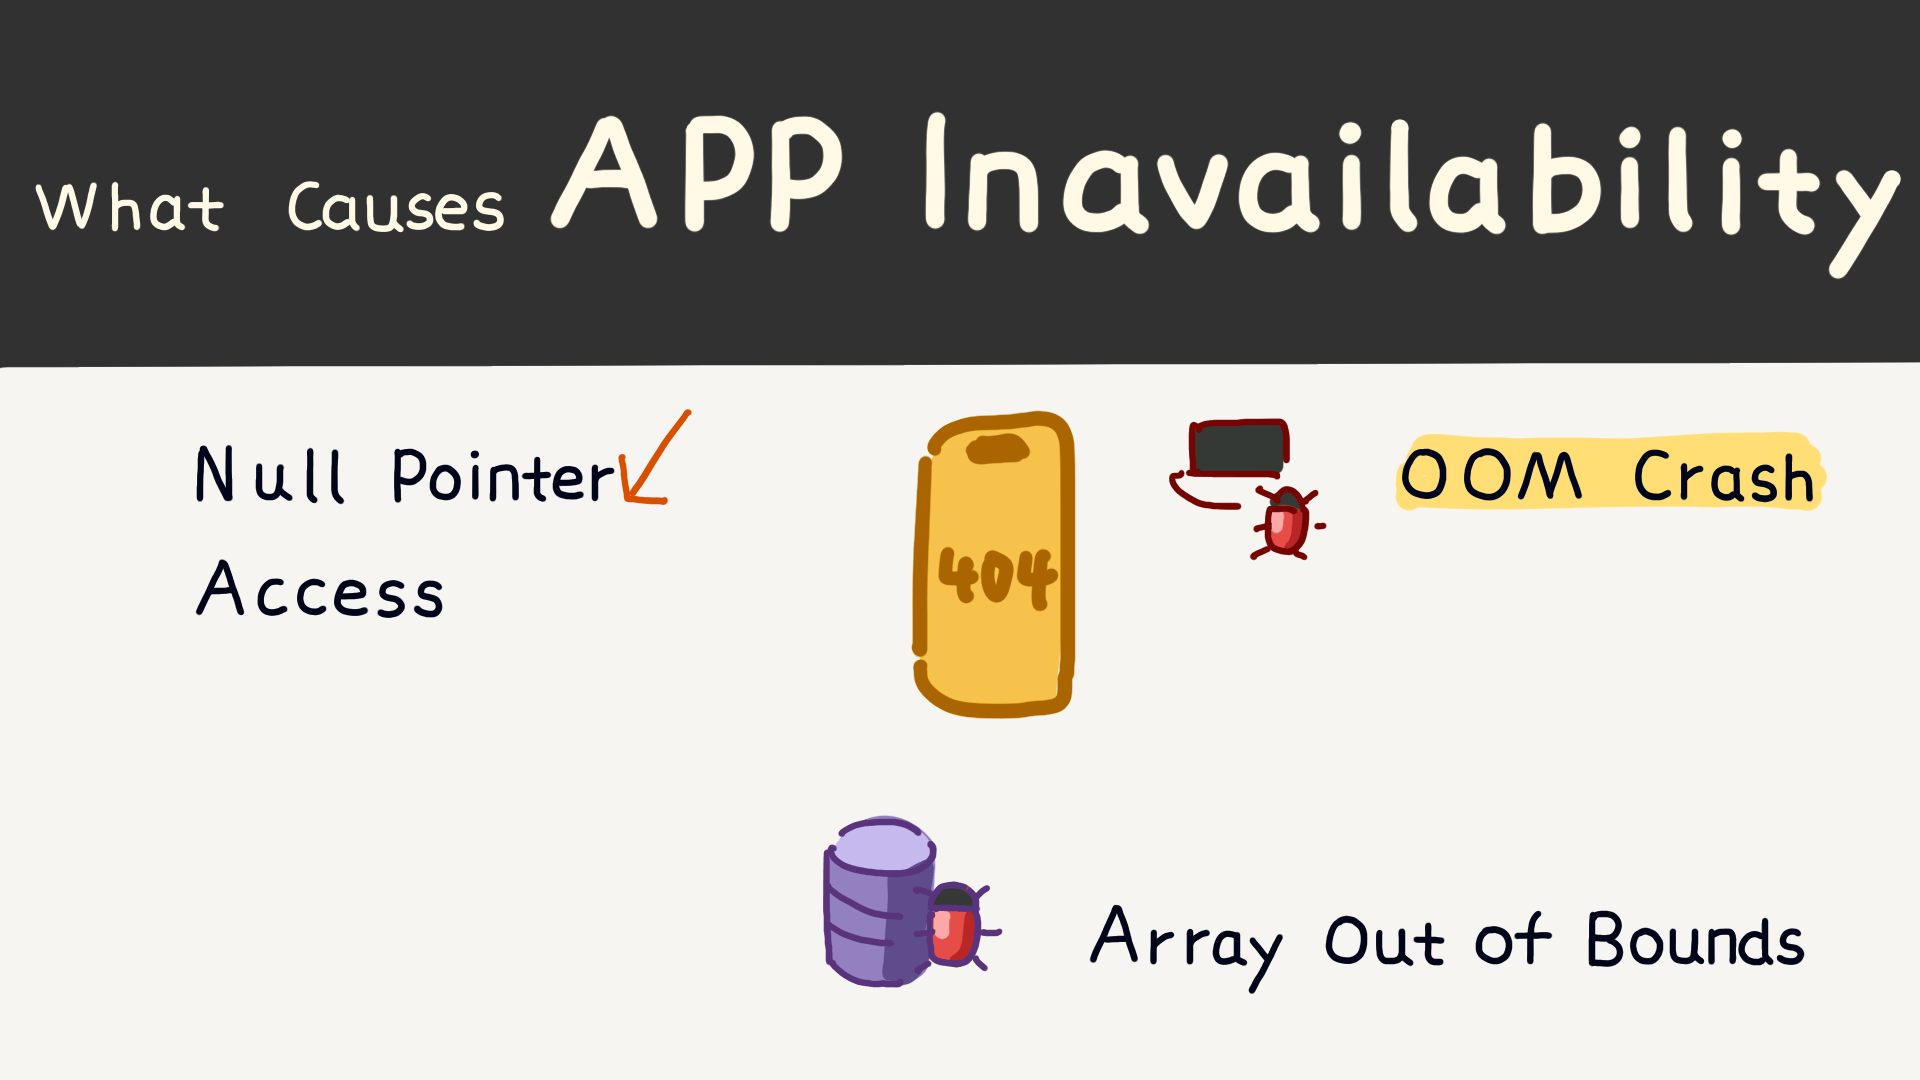
These are the three most common causes of crashes, with memory issues being the hardest to resolve. Next, I’ll focus on how to address memory issues.
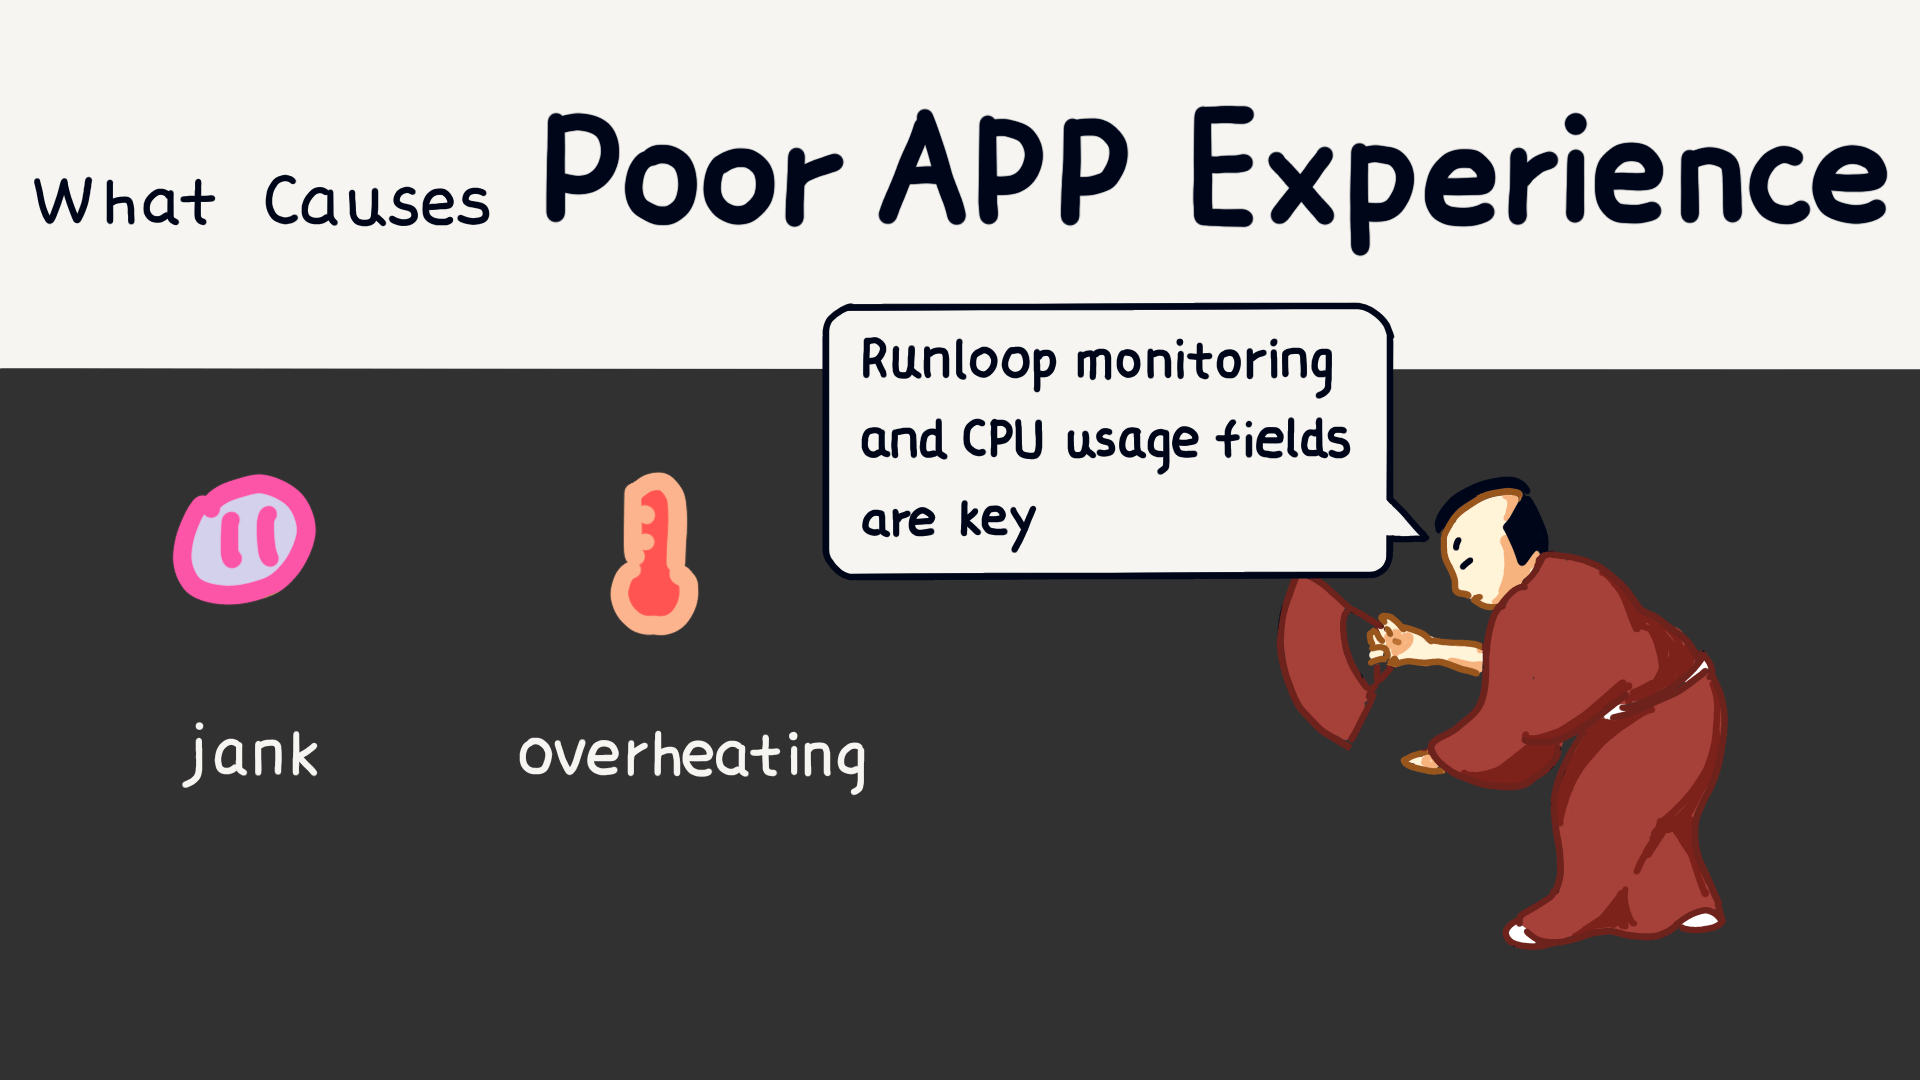
In addition to crashes, performance issues can also affect the user experience, such as lagging or overheating.
- Lag can be identified through Runloop monitoring to locate the part of the stack where execution takes too long;
- Overheating can be addressed by monitoring CPU usage in threads to find the threads or methods causing CPU overload.
Slow app startup and large package sizes also impact user experience. As projects grow in complexity, solving these problems becomes increasingly challenging.
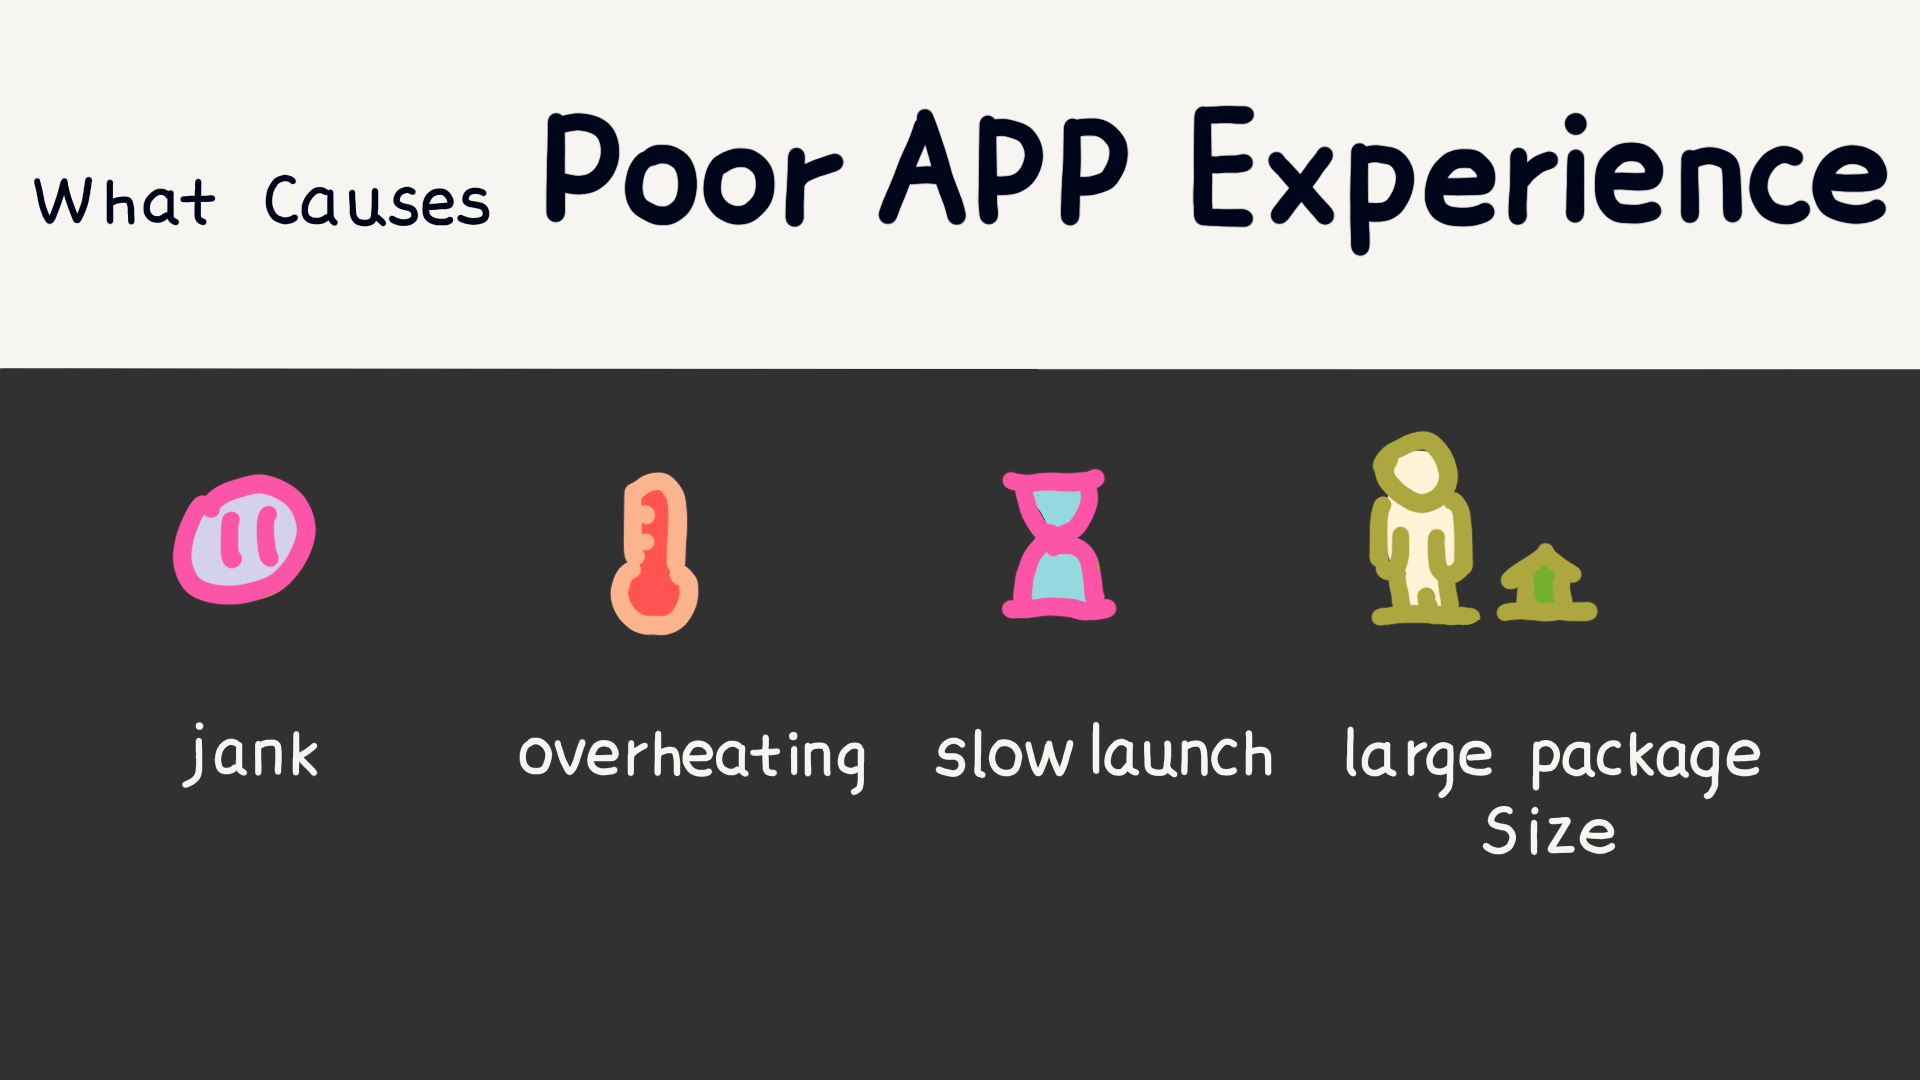
The above four issues lead to a poor user experience.
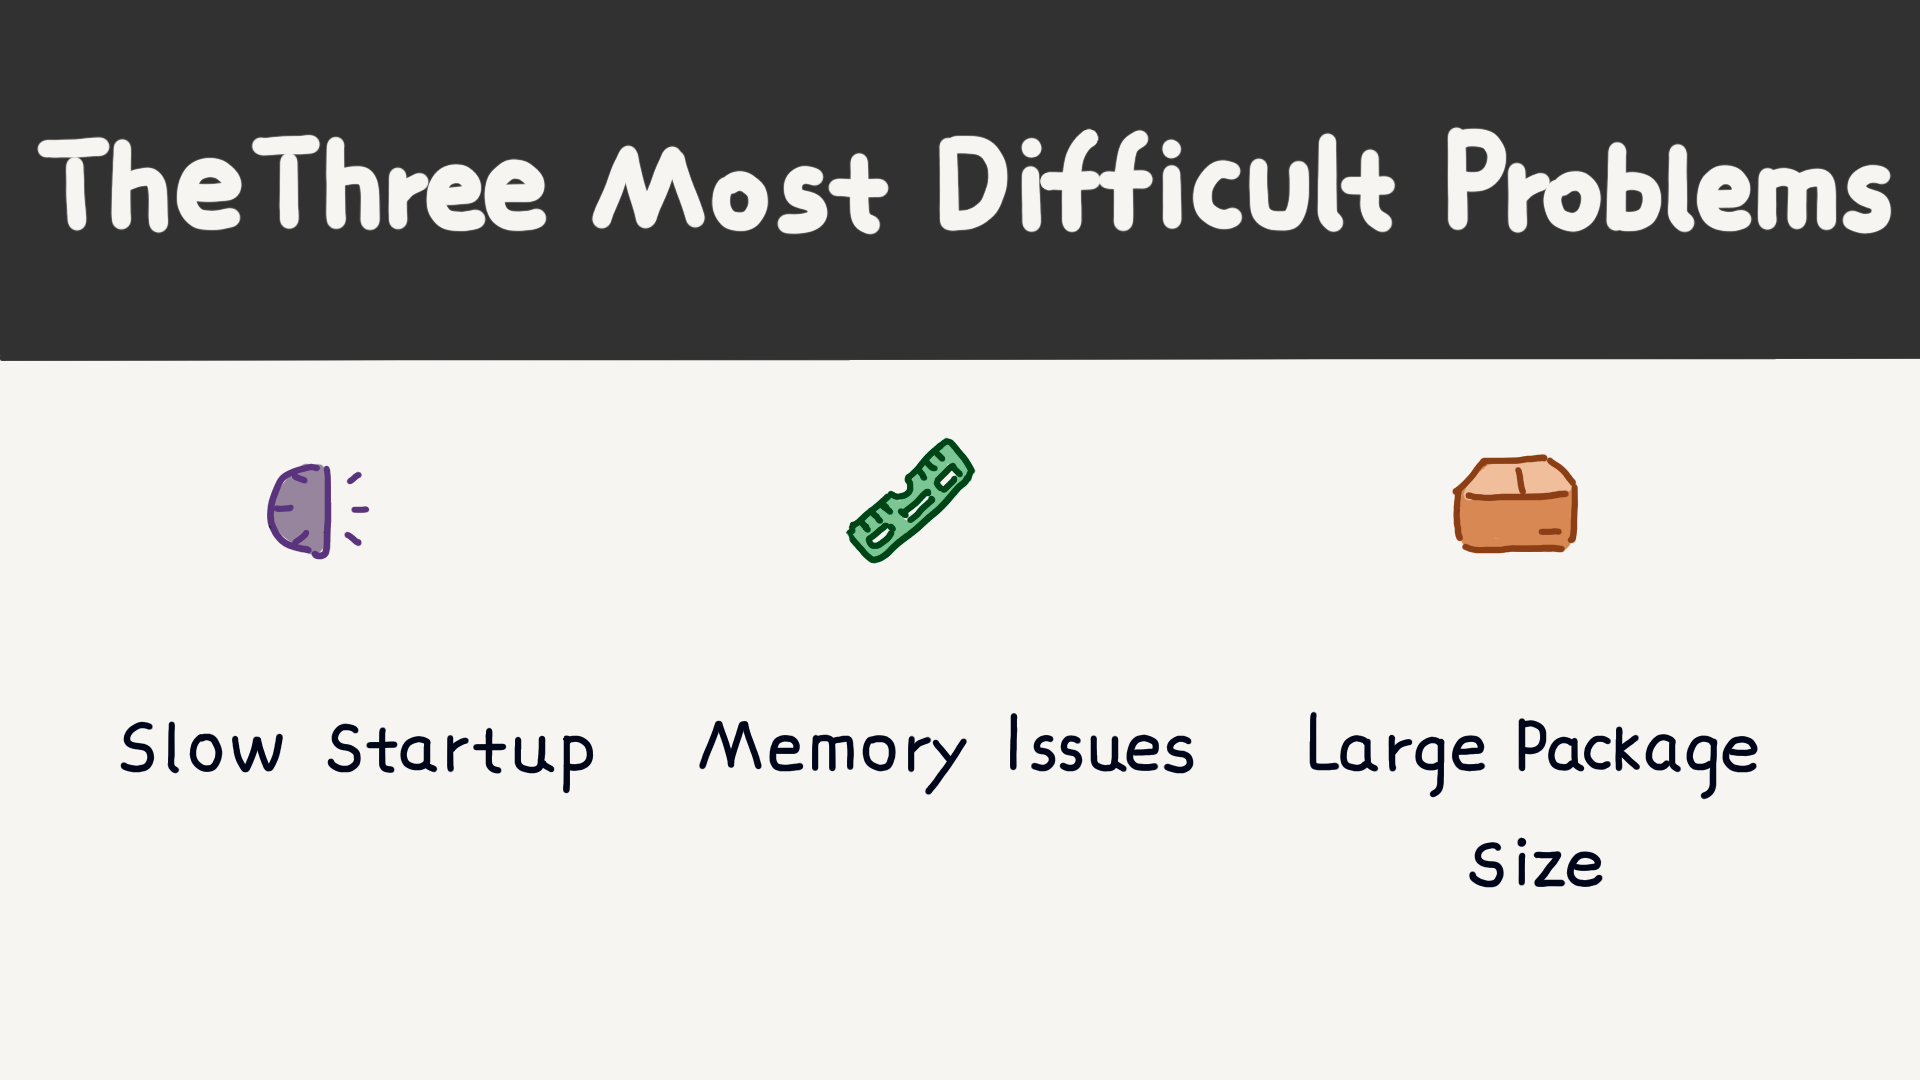
Upon analysis, these three problems are the hardest to solve: memory issues, slow startup, and large package sizes. I will focus on sharing some of the latest solutions to these problems next.
Memory issues fundamentally stem from improper memory usage. Memory is a finite resource, and if we misuse it, problems will inevitably arise.
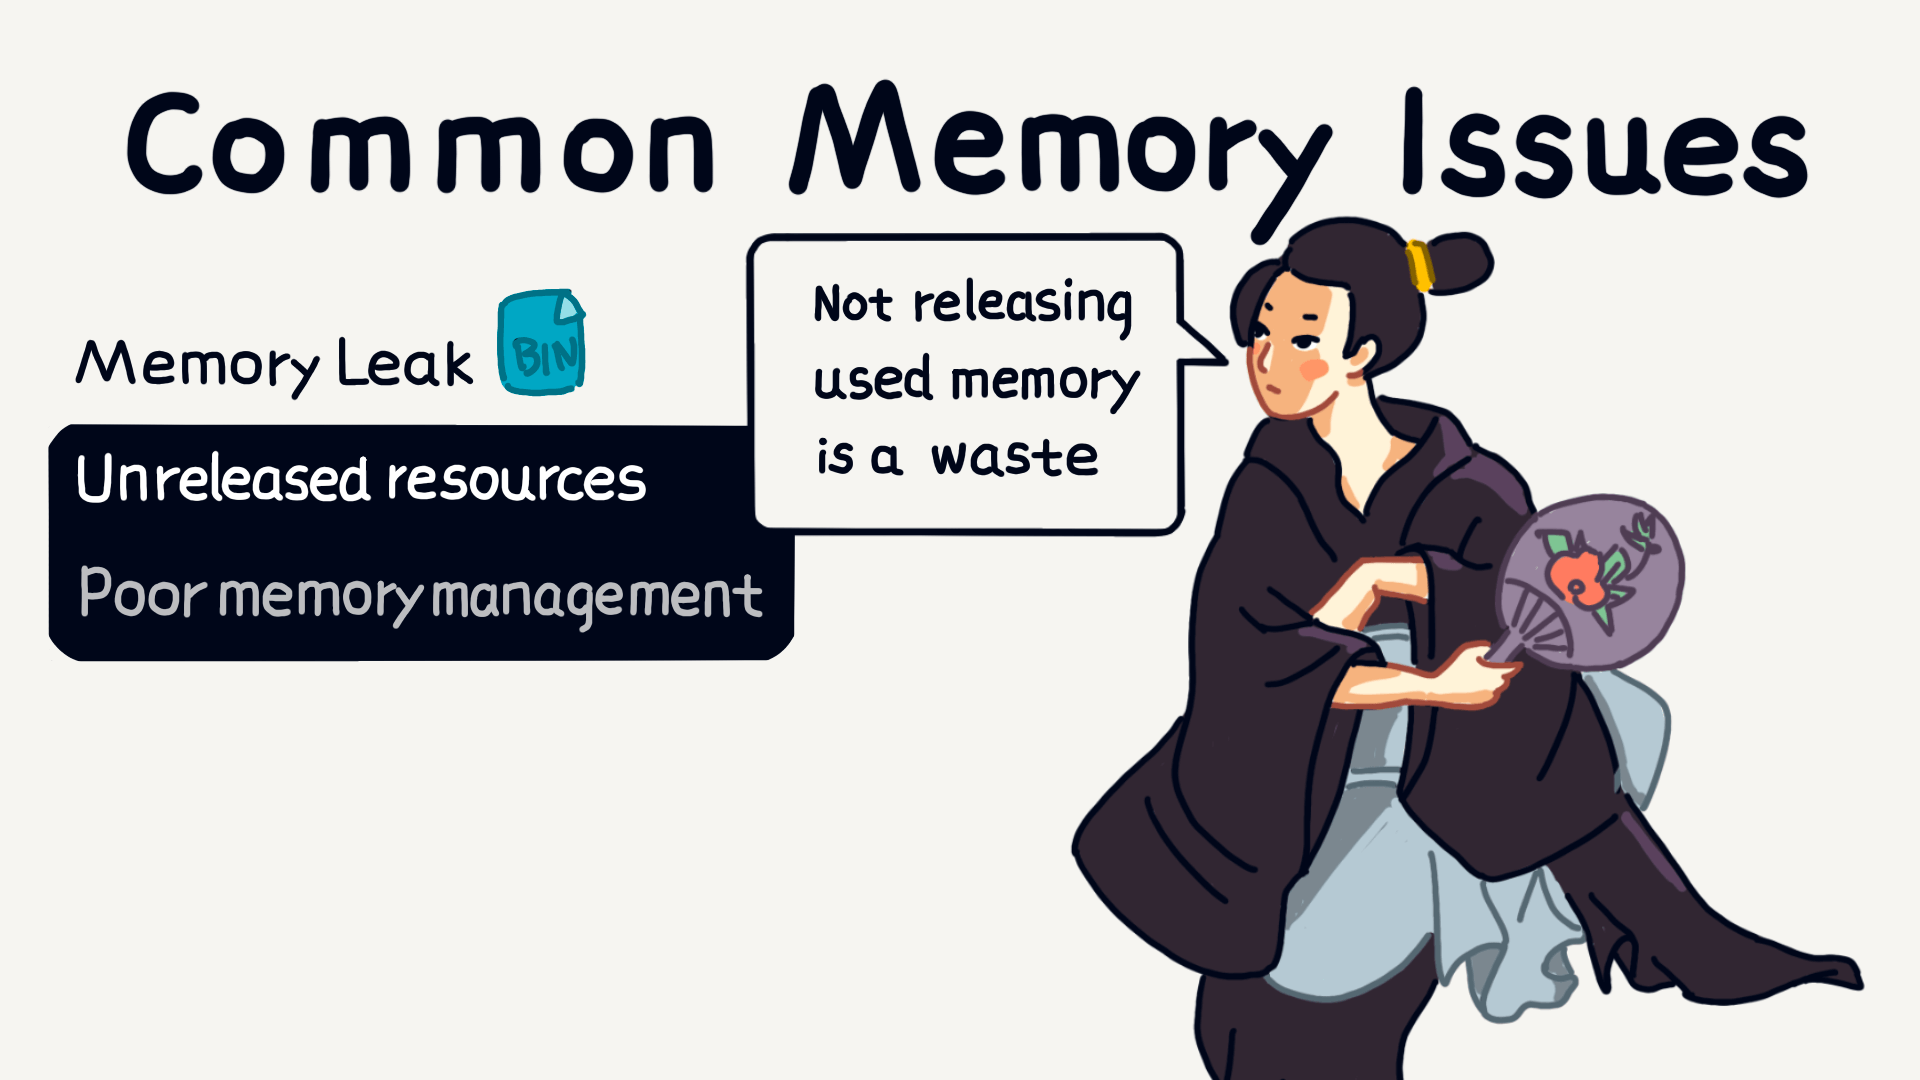
The most common memory issues are threefold: the first is memory leaks, where memory is not released after being used, leading to increasing memory consumption.

The second issue is high memory peaks. When memory usage suddenly spikes at a certain point, the system may trigger the Jetsam mechanism, killing the app directly.

The third issue is memory thrashing, which refers to frequent garbage collection, causing performance corruption.
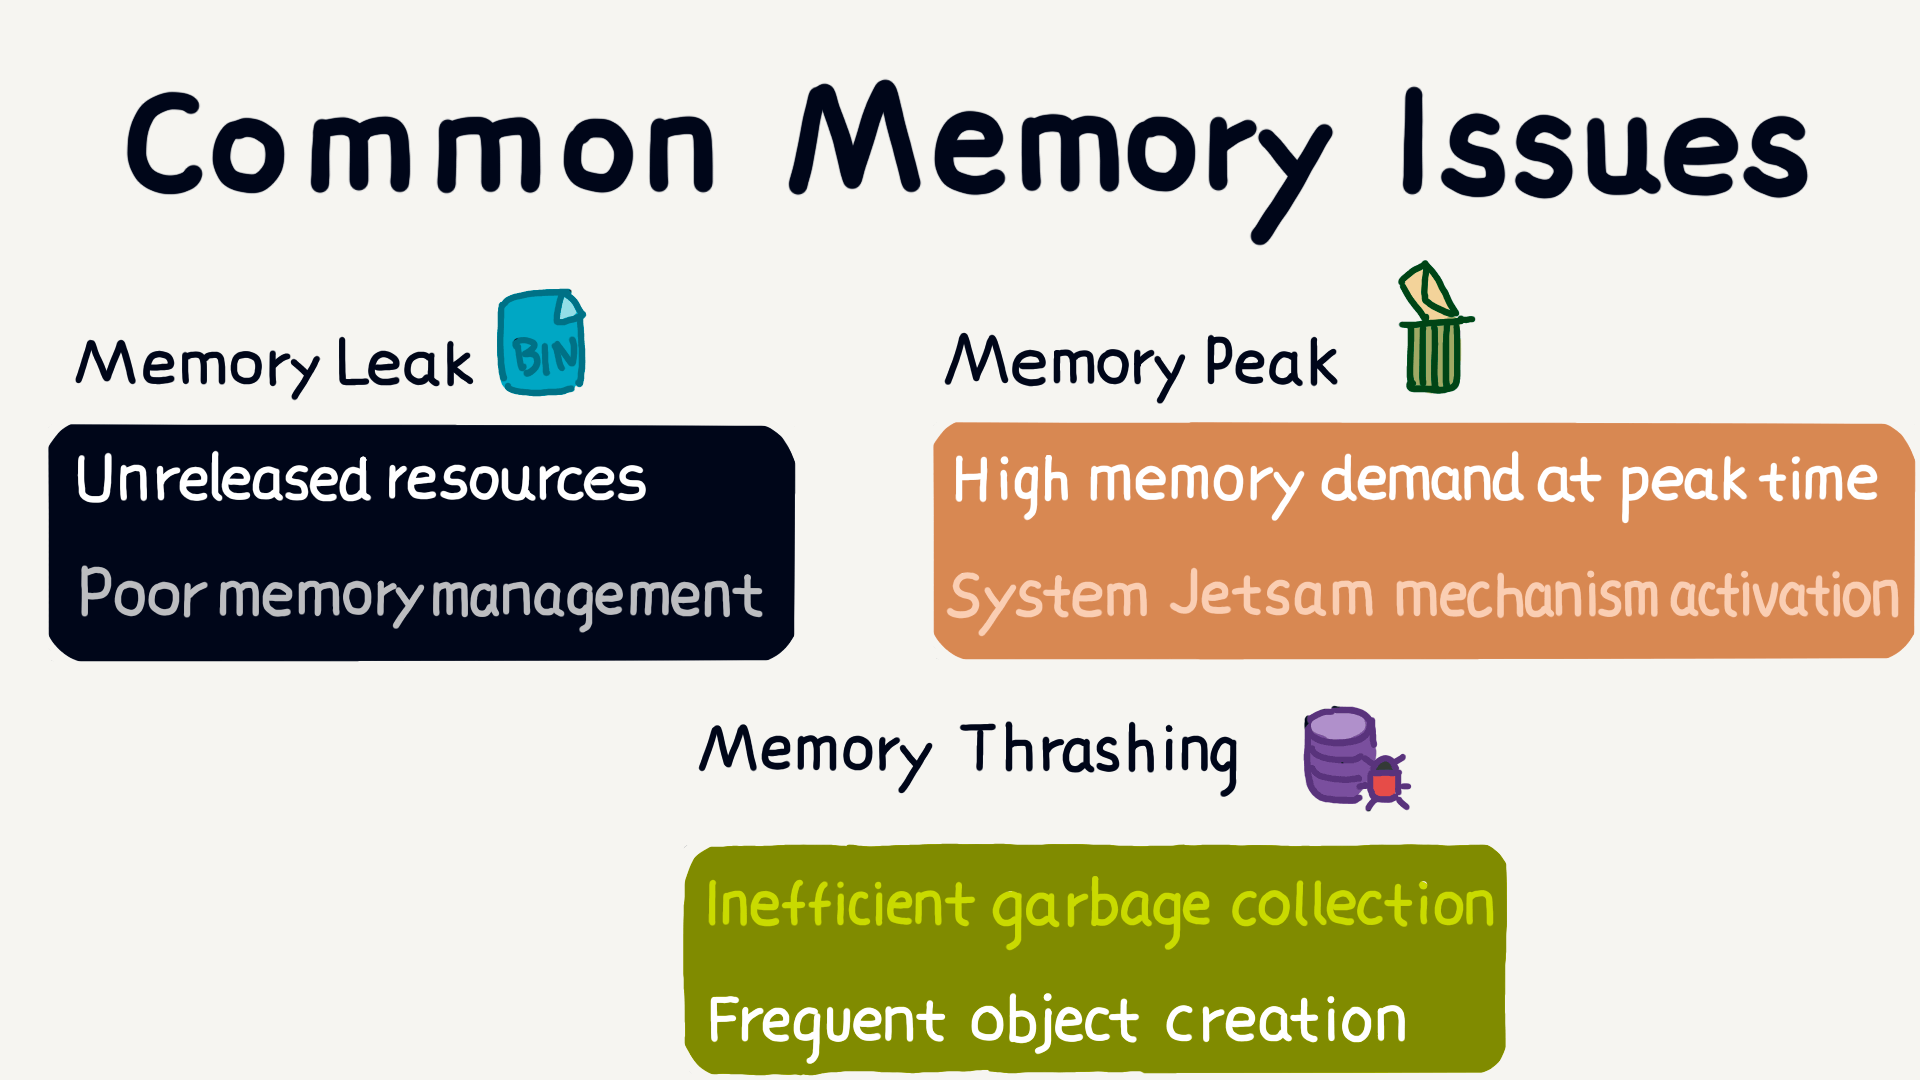
So, memory leaks, high memory peaks, and memory thrashing are the most common memory issues.
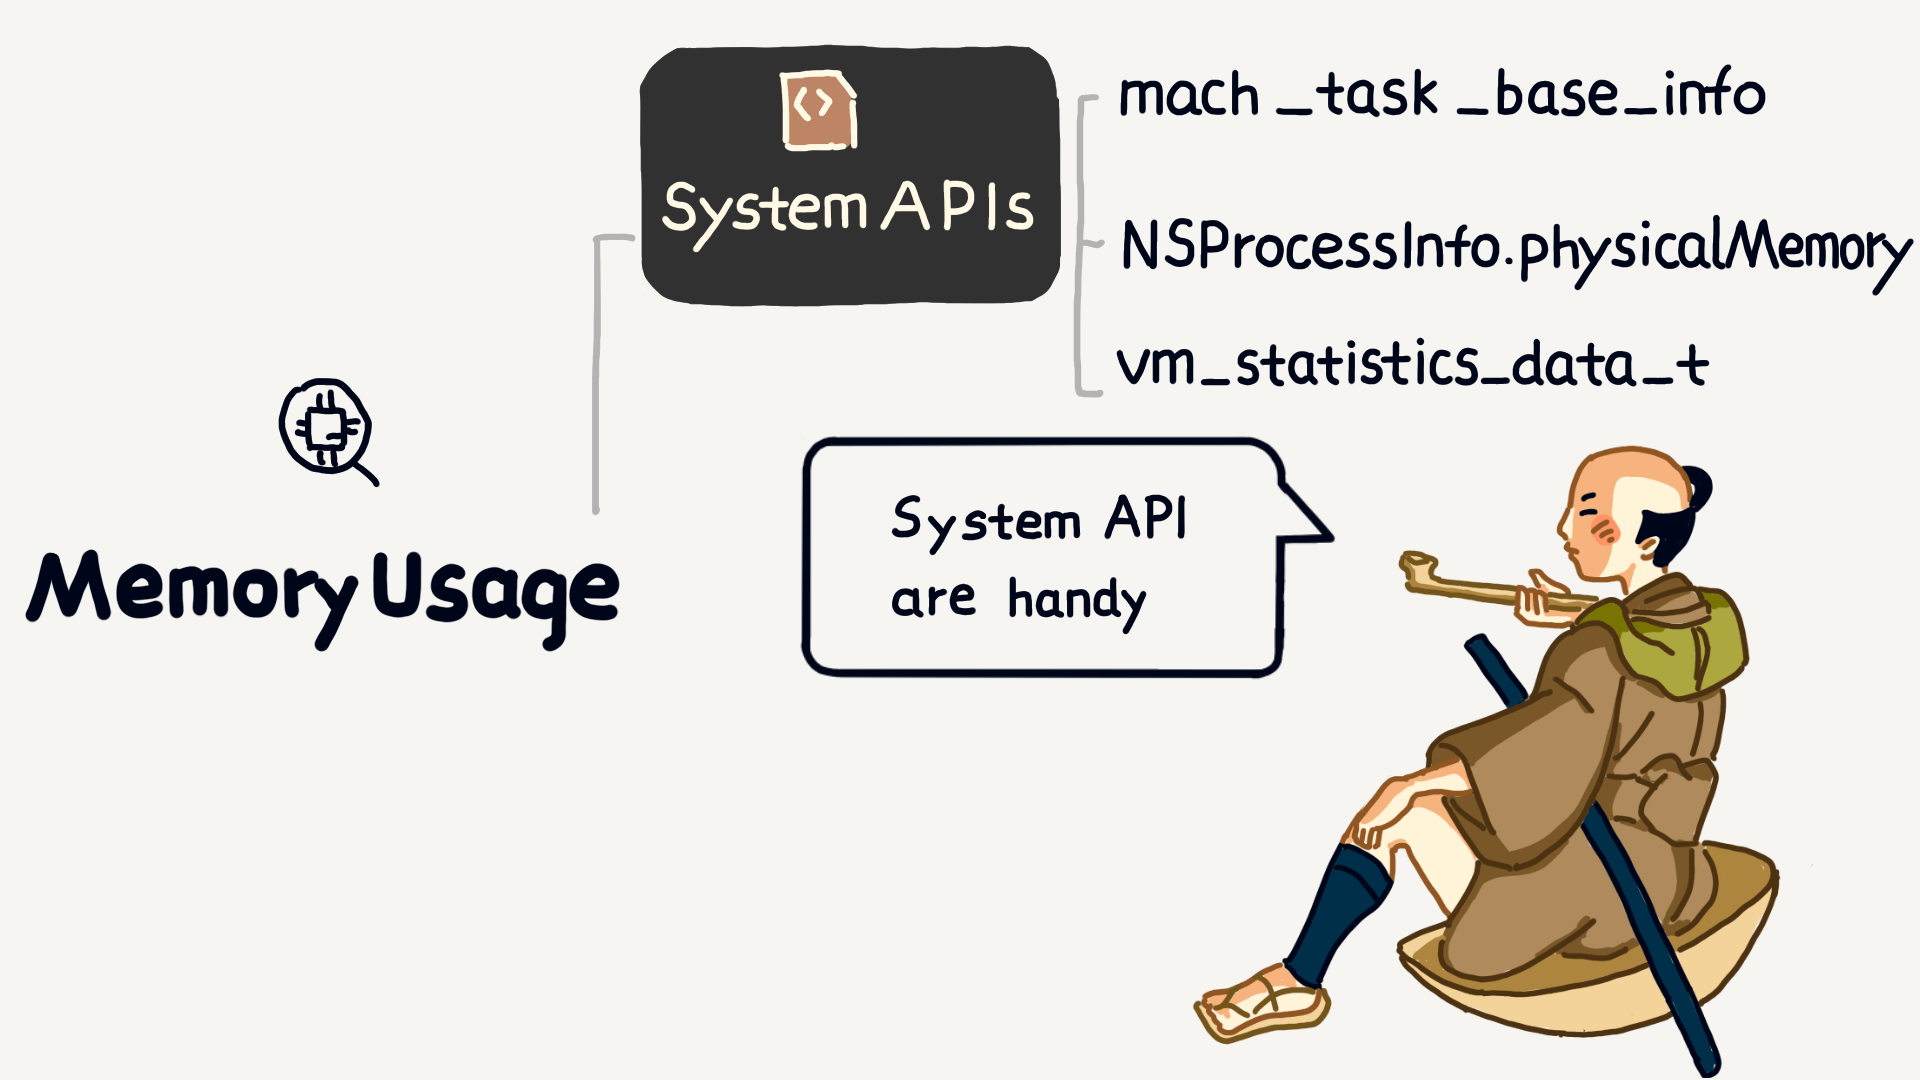
To solve memory issues, the first step is to understand memory usage. We can retrieve this information using system APIs, such as mach_task_basic_info, the physicalMemory property of NSProcessInfo, and the vm_statistics_data_t structure.
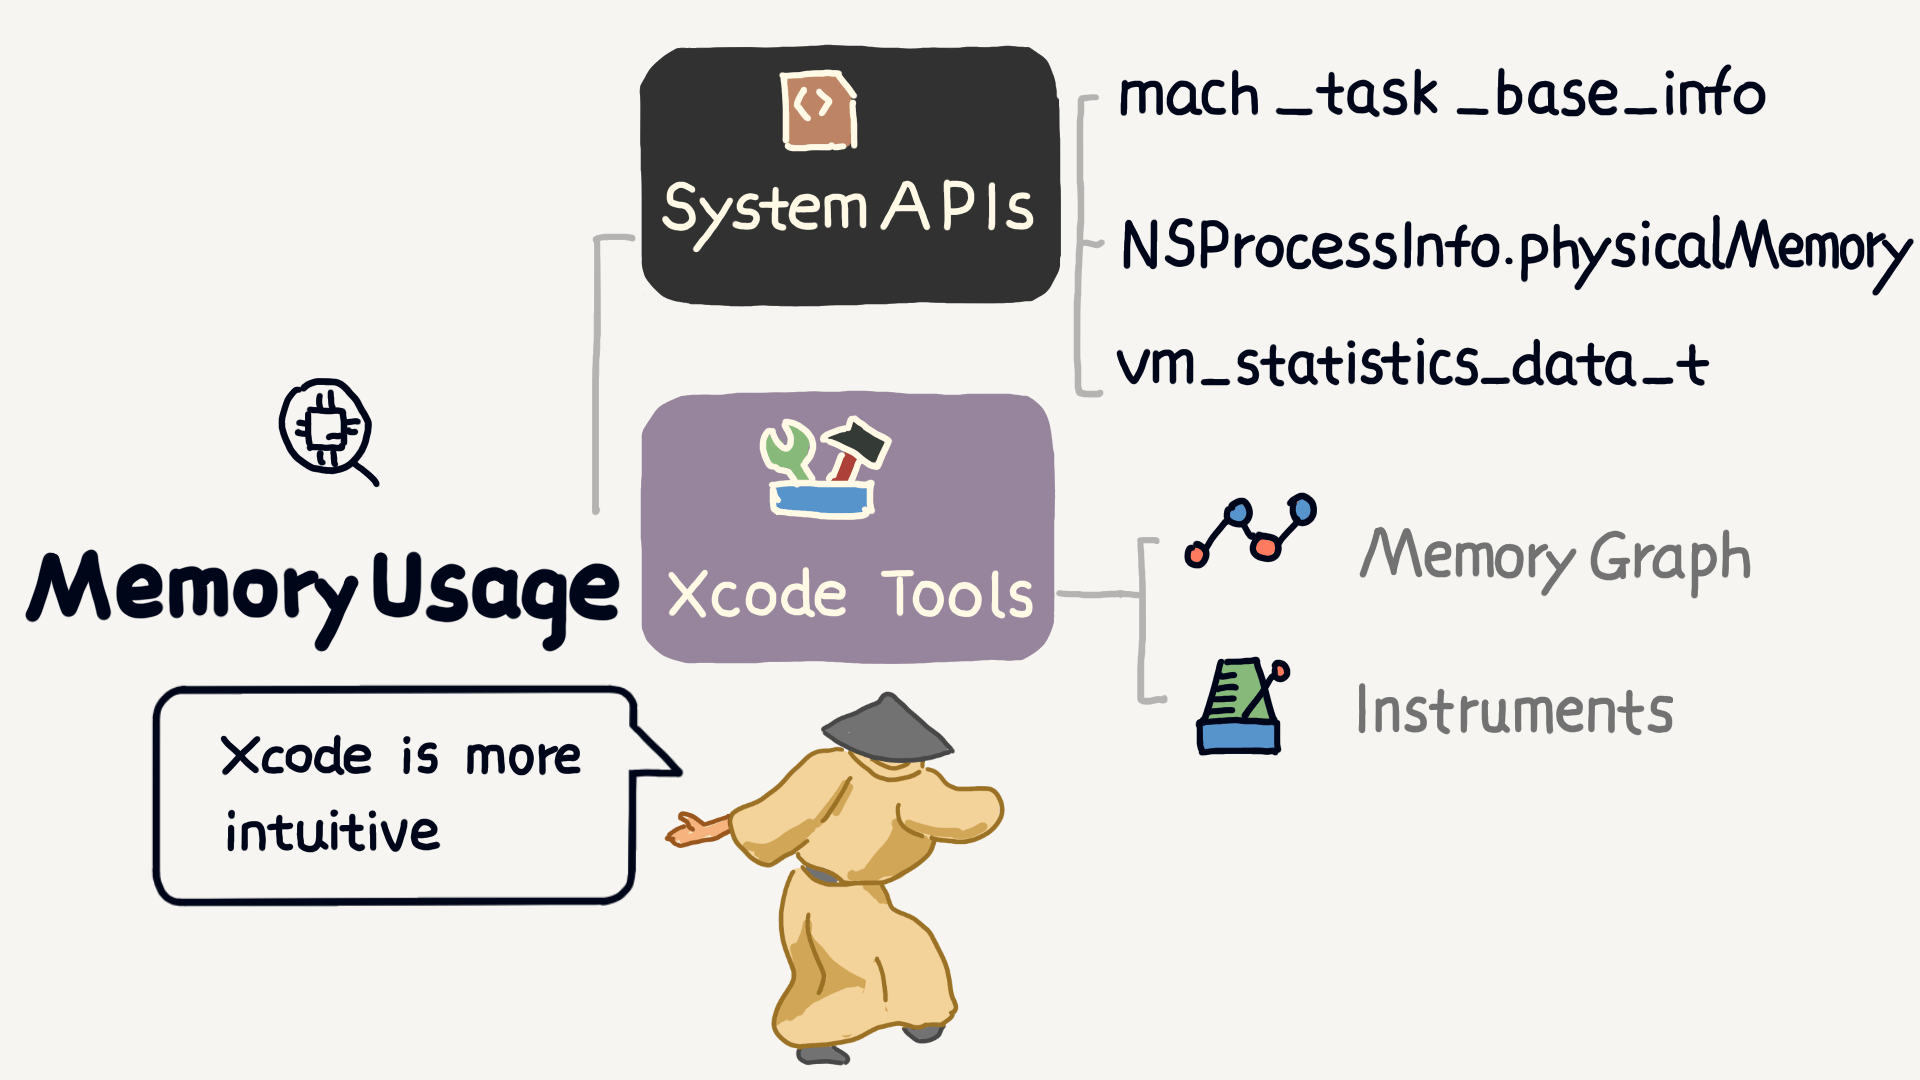
In addition to APIs, Xcode’s Memory Graph feature is very intuitive, allowing you to view the app’s memory usage in real-time, making it a very handy tool.

There are also some open-source libraries, such as KSCrash, which provide freeMemory and usableMemory functions to retrieve information about the system’s free and available memory.

Using these methods, we can clearly monitor the app’s memory usage.

What may seem like a small memory leak can accumulate over time, eventually causing system performance worse or even triggering an OOM crash.
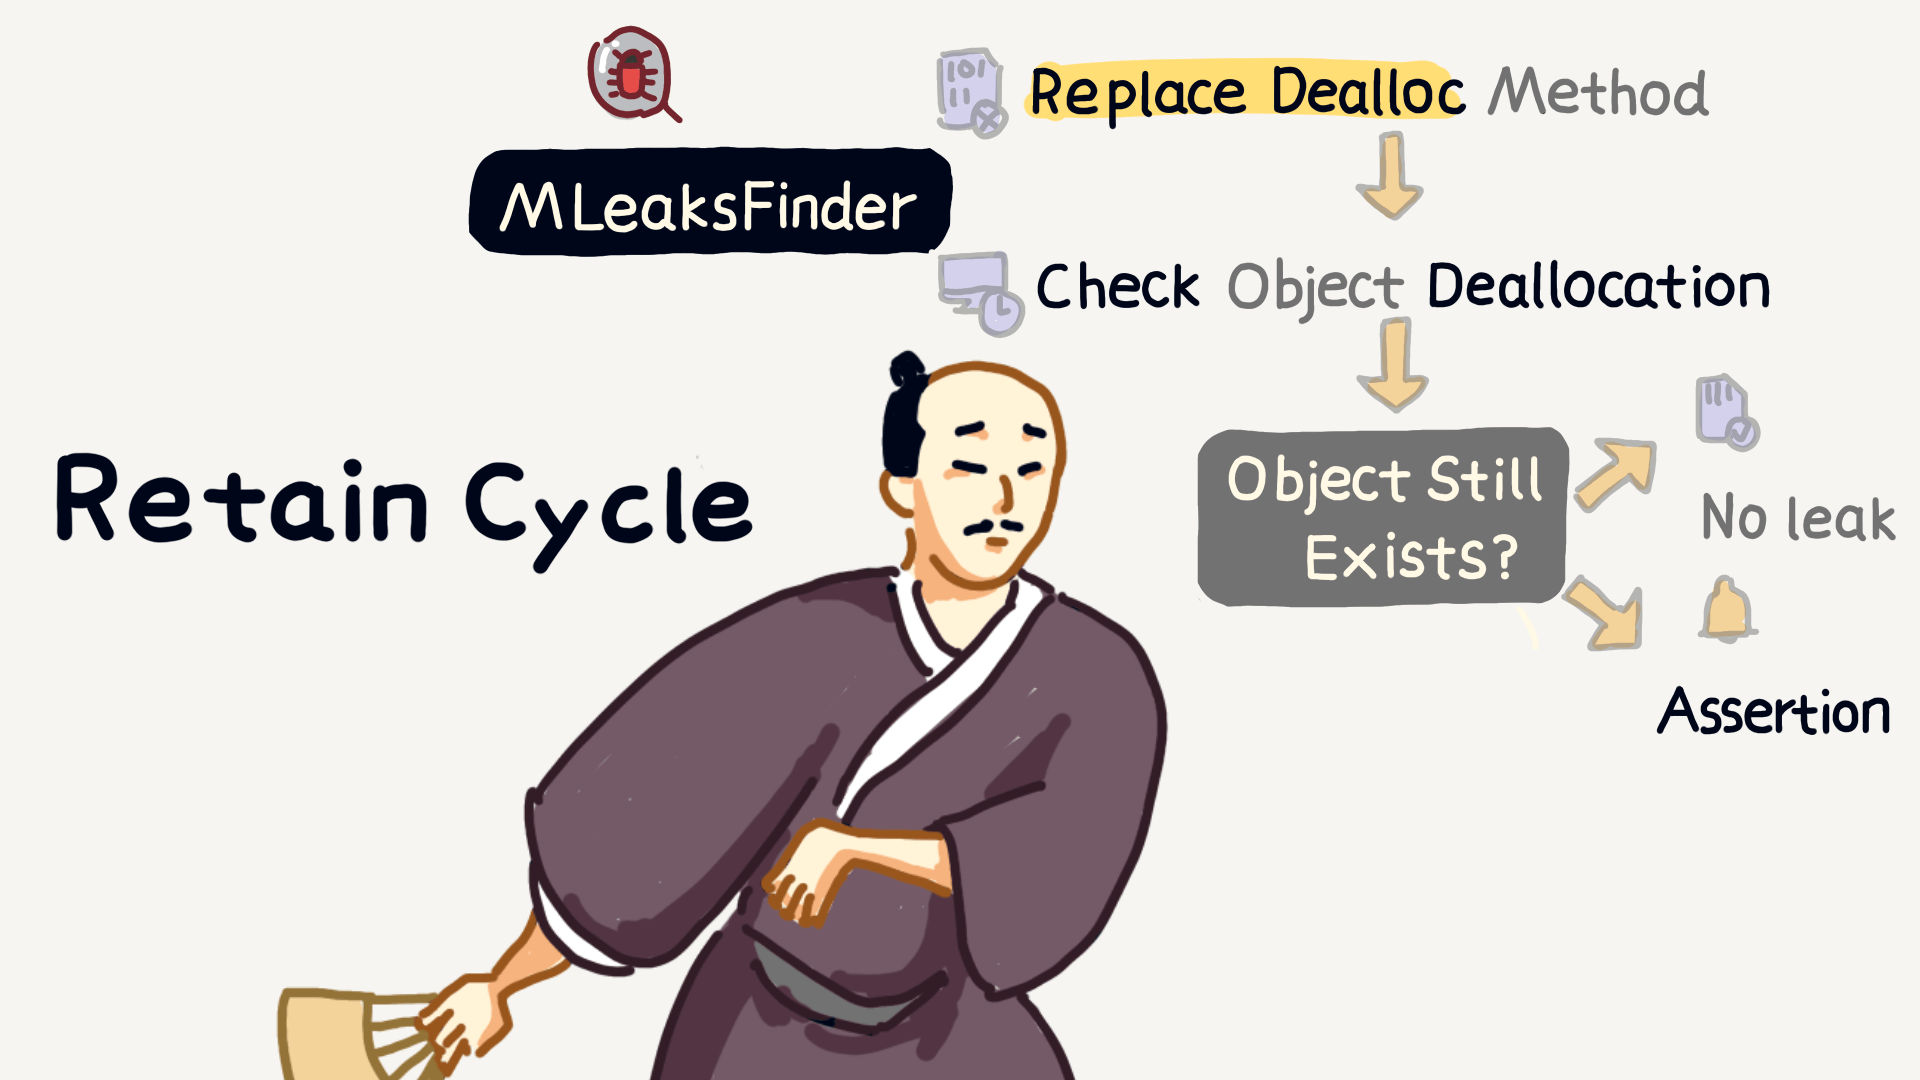
The most common cause of memory leaks is retain cycles. Here are two open-source tools that can help us detect retain cycles.
The first is MLeaksFinder. It hooks the dealloc method to check whether an object still exists after being released, thereby determining if there is a memory leak.
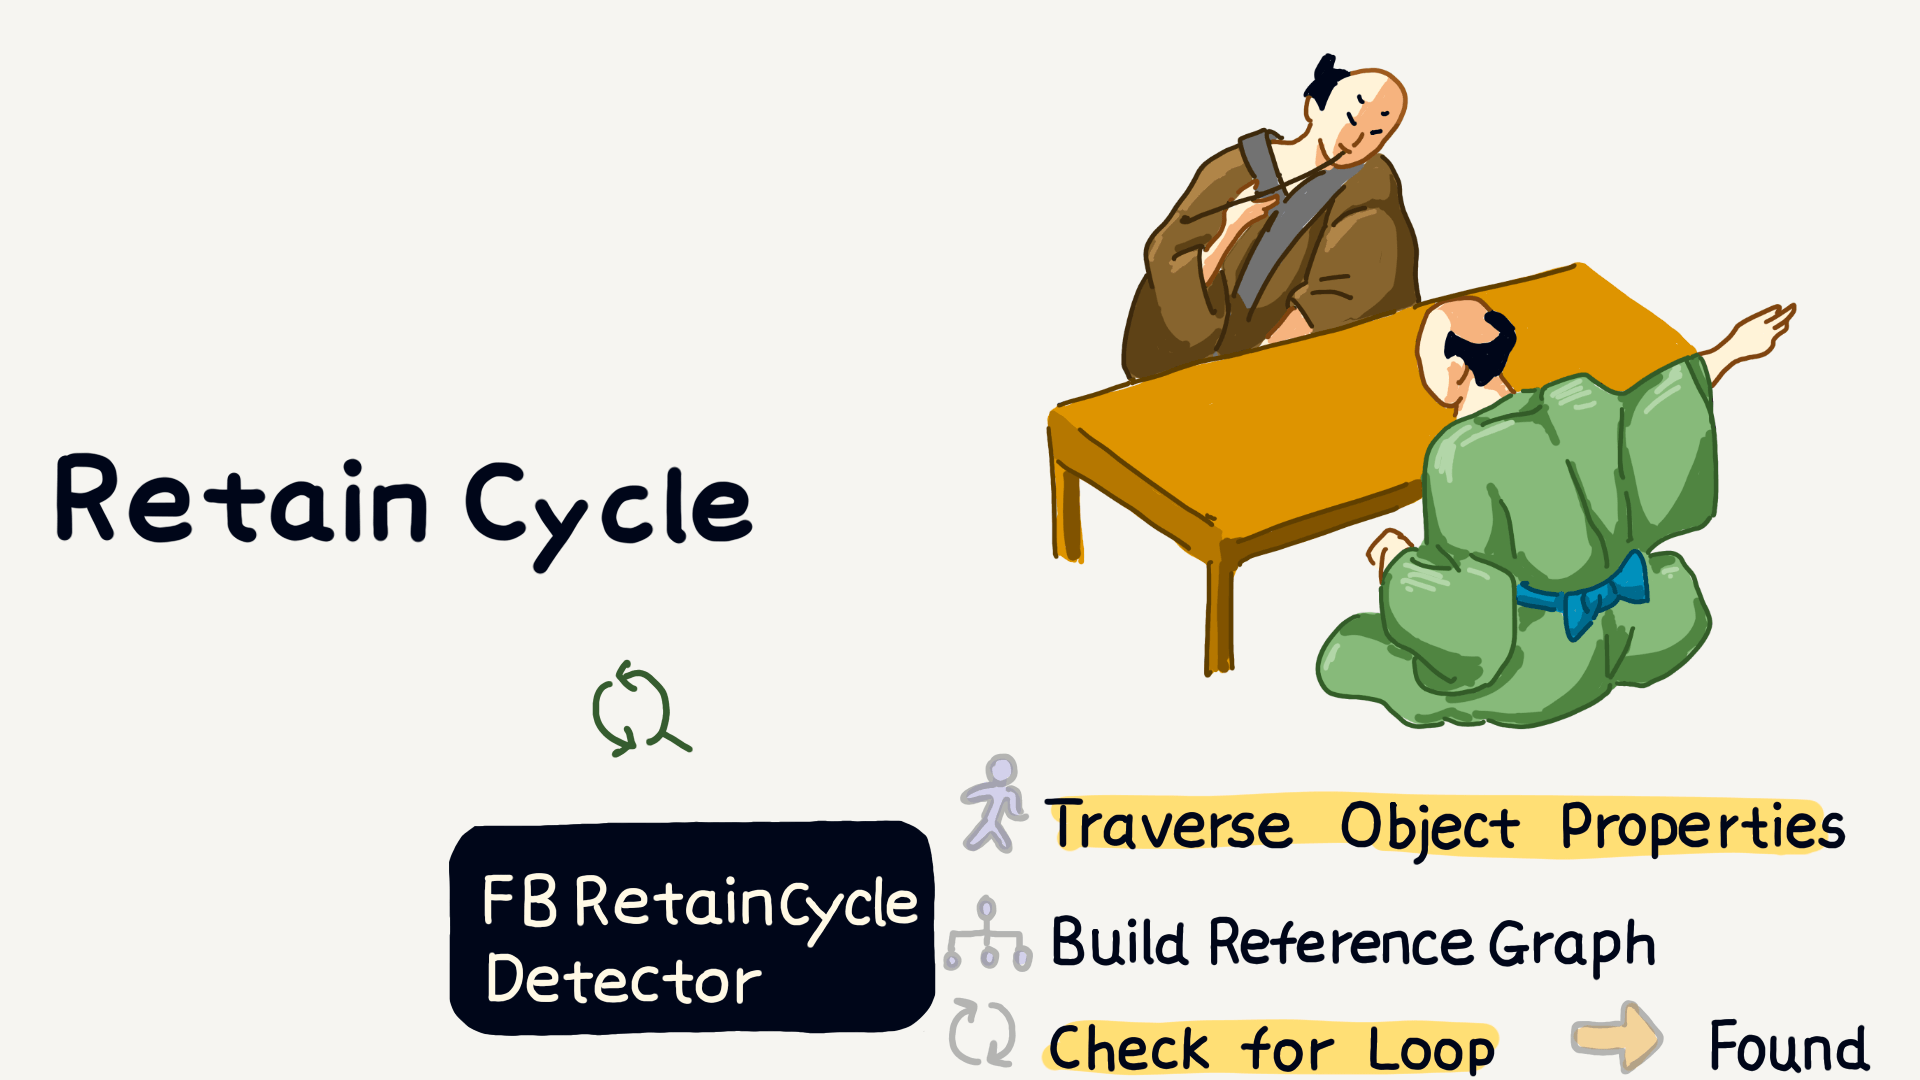
The second tool is FBRetainCycleDetector. It traverses strong references between objects and builds a reference graph. If it detects a cycle, it indicates a retain cycle issue.
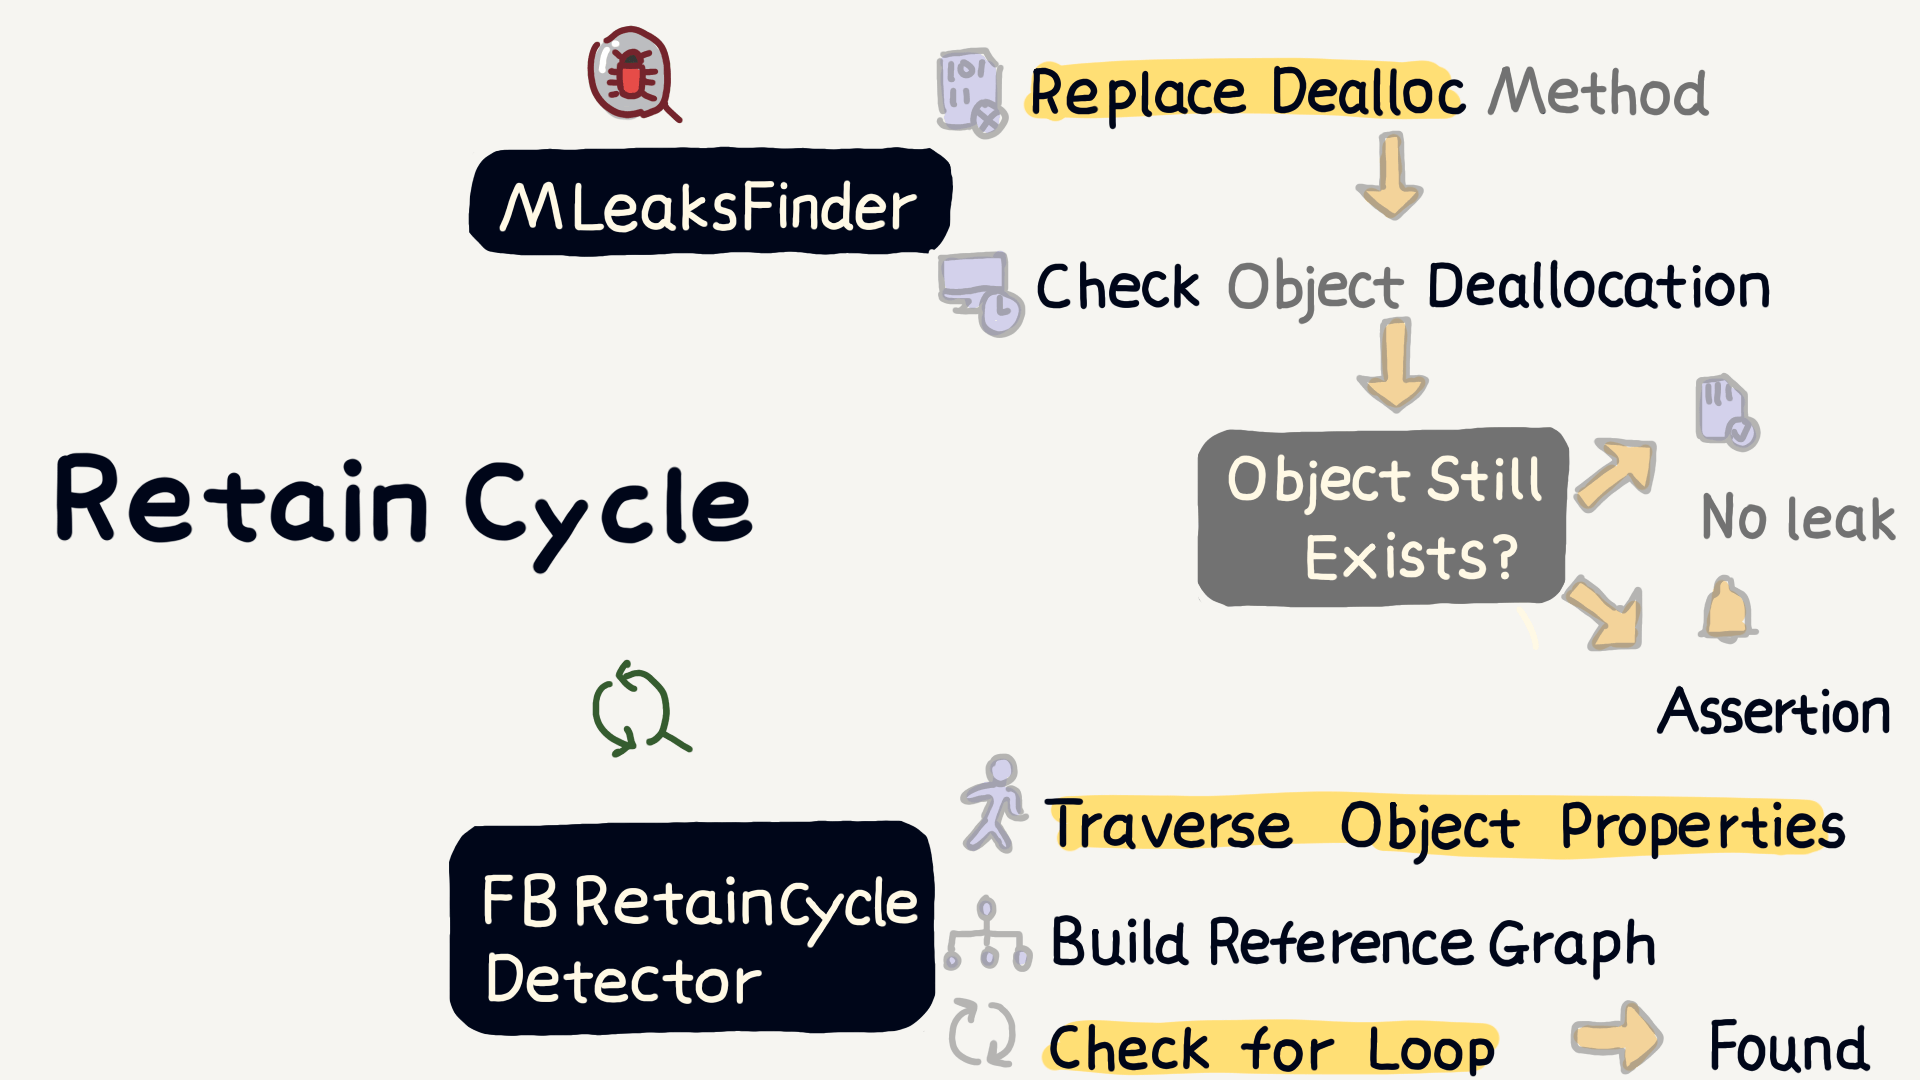
Retain cycles are relatively easy to detect. In addition to these open-source tools, Xcode’s tools can also help us detect memory leaks in a visual way.

In contrast, memory peaks and memory thrashing are like hide “little monsters” and are harder to detect. So, how do we track down these problems like detectives?

Here’s one method: by repeatedly sampling memory usage, we can calculate the differences and identify the objects with the fastest memory growth.

Rank the top 100 objects with the most significant growth. Specifically, this can be done by hooking the alloc and dealloc methods to track the allocation and release of objects.

Each time memory is allocated, we can maintain a counter—incrementing the counter on alloc and decrementing it on dealloc—this way, we can keep track of the number of currently active objects.
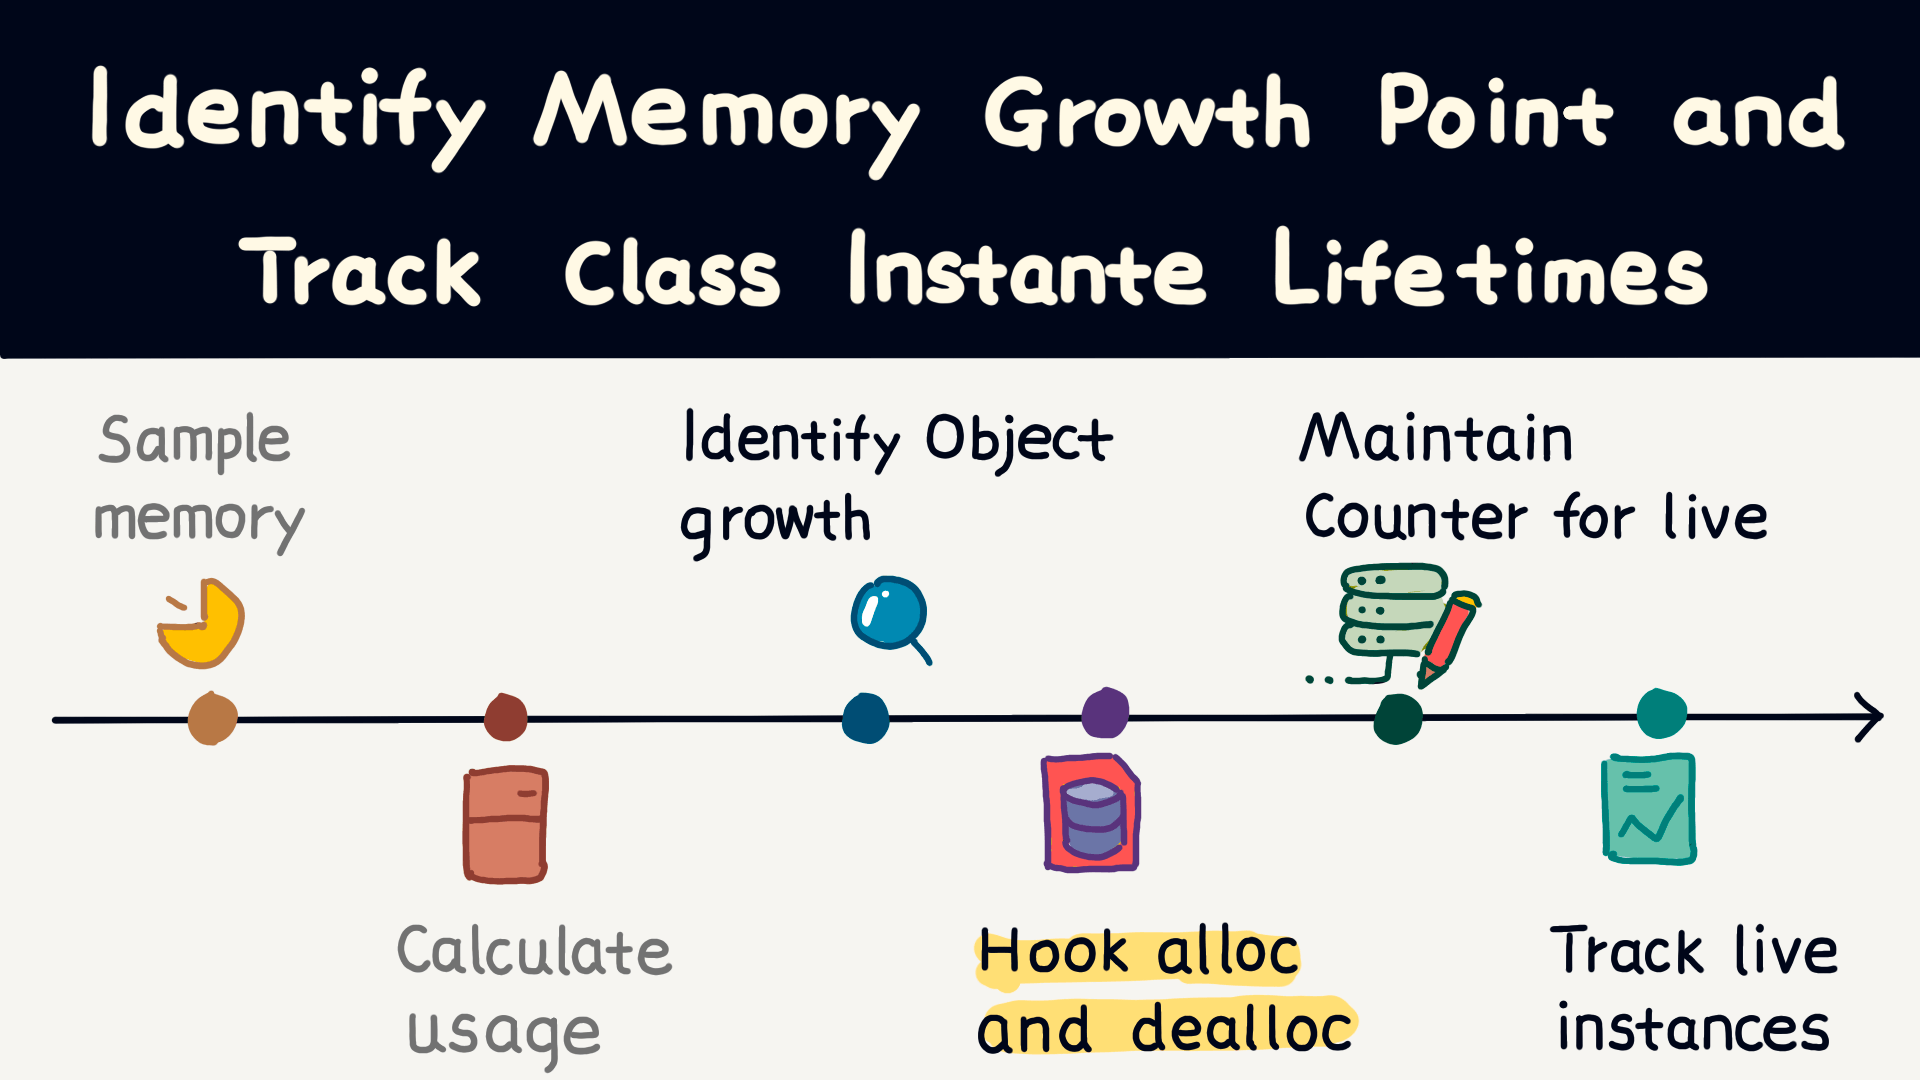
With this method, we can pinpoint the objects with the fastest memory growth, making it easier for further analysis.
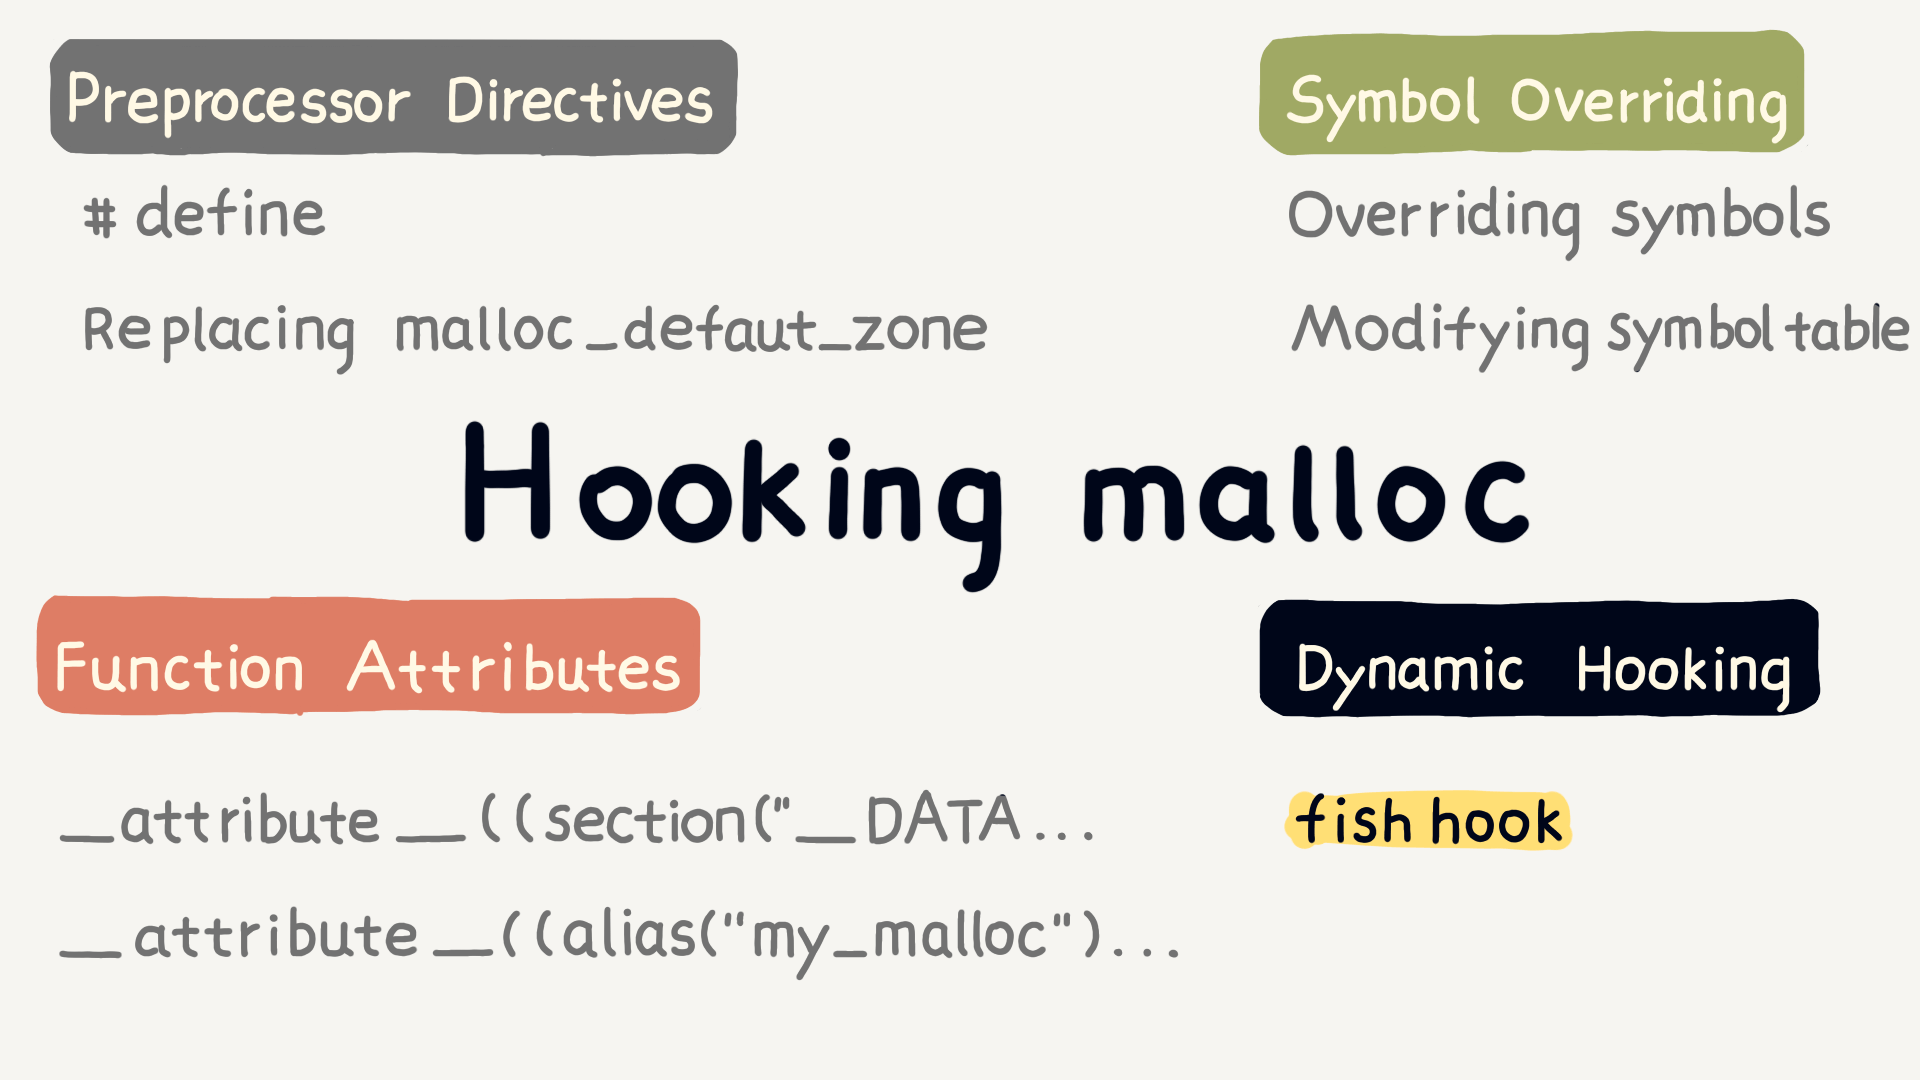
Next, let’s introduce hook malloc, which allows us to capture every memory management operation. It’s like planting a “secret agent” to monitor each memory allocation action.
Below are some common methods to hook malloc, including macro definitions, symbol overriding, and function attributes. The most flexible method is using fishhook, which allows dynamic toggling.

fishhook is a technique that modifies Mach-O file symbols to achieve function replacement. We can use it to replace the malloc function.
In the code above, the purpose of rebind_symbol is to replace the malloc function with our custom-defined custom_malloc function. The second parameter, original_malloc, indicates that after replacing the function, the original function will continue to be executed.
This way, with each memory allocation, through the custom_malloc function, we can capture the size and address of every memory allocation.

Additionally, the system’s built-in malloc_logger tool can also comprehensively record the memory allocation process, offering a more straightforward solution.

malloc_logger is essentially a callback function. When memory is allocated or released, it will callback and log relevant information.
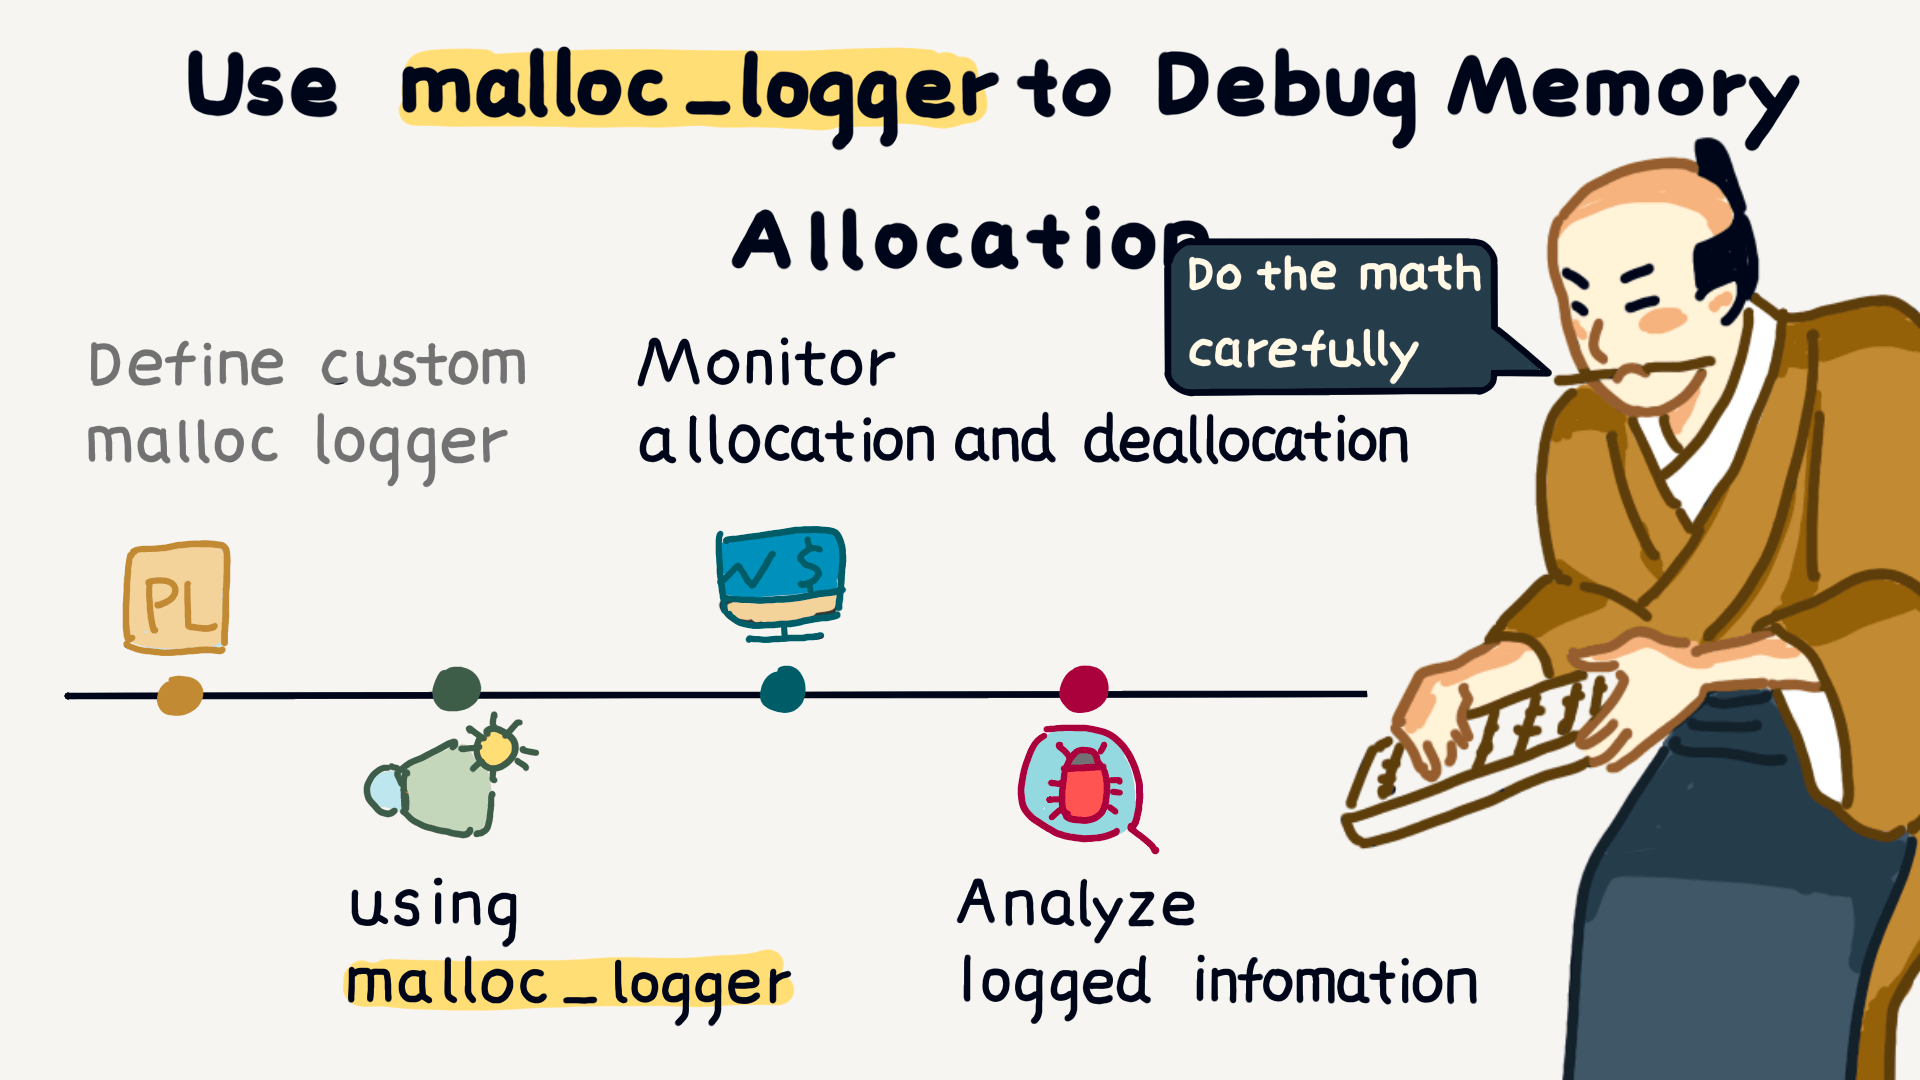
By tracking malloc and free operations, we can discover memory blocks that haven’t been correctly released.

After solving memory issues, remember to retest to ensure the problem is completely resolved.
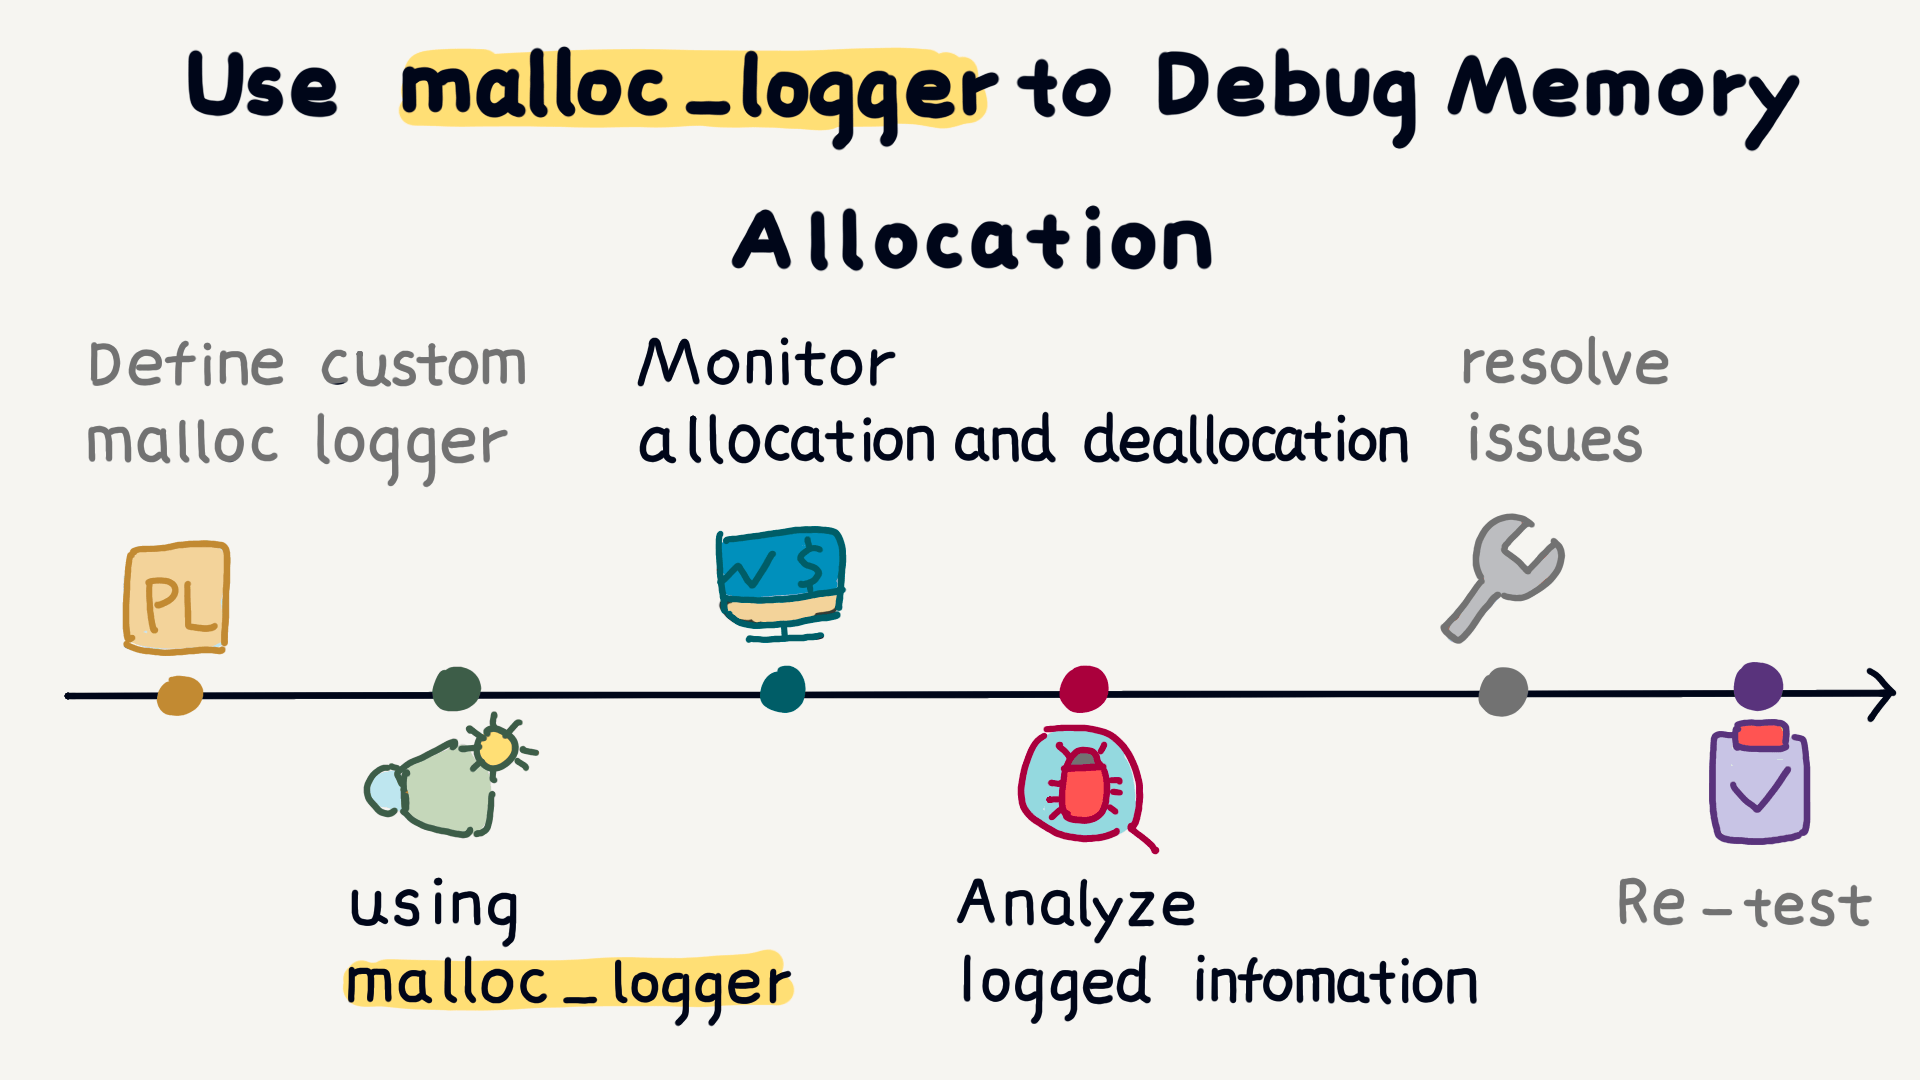
Next, let’s look at how to customize this malloc_logger function to capture memory allocation and release information.
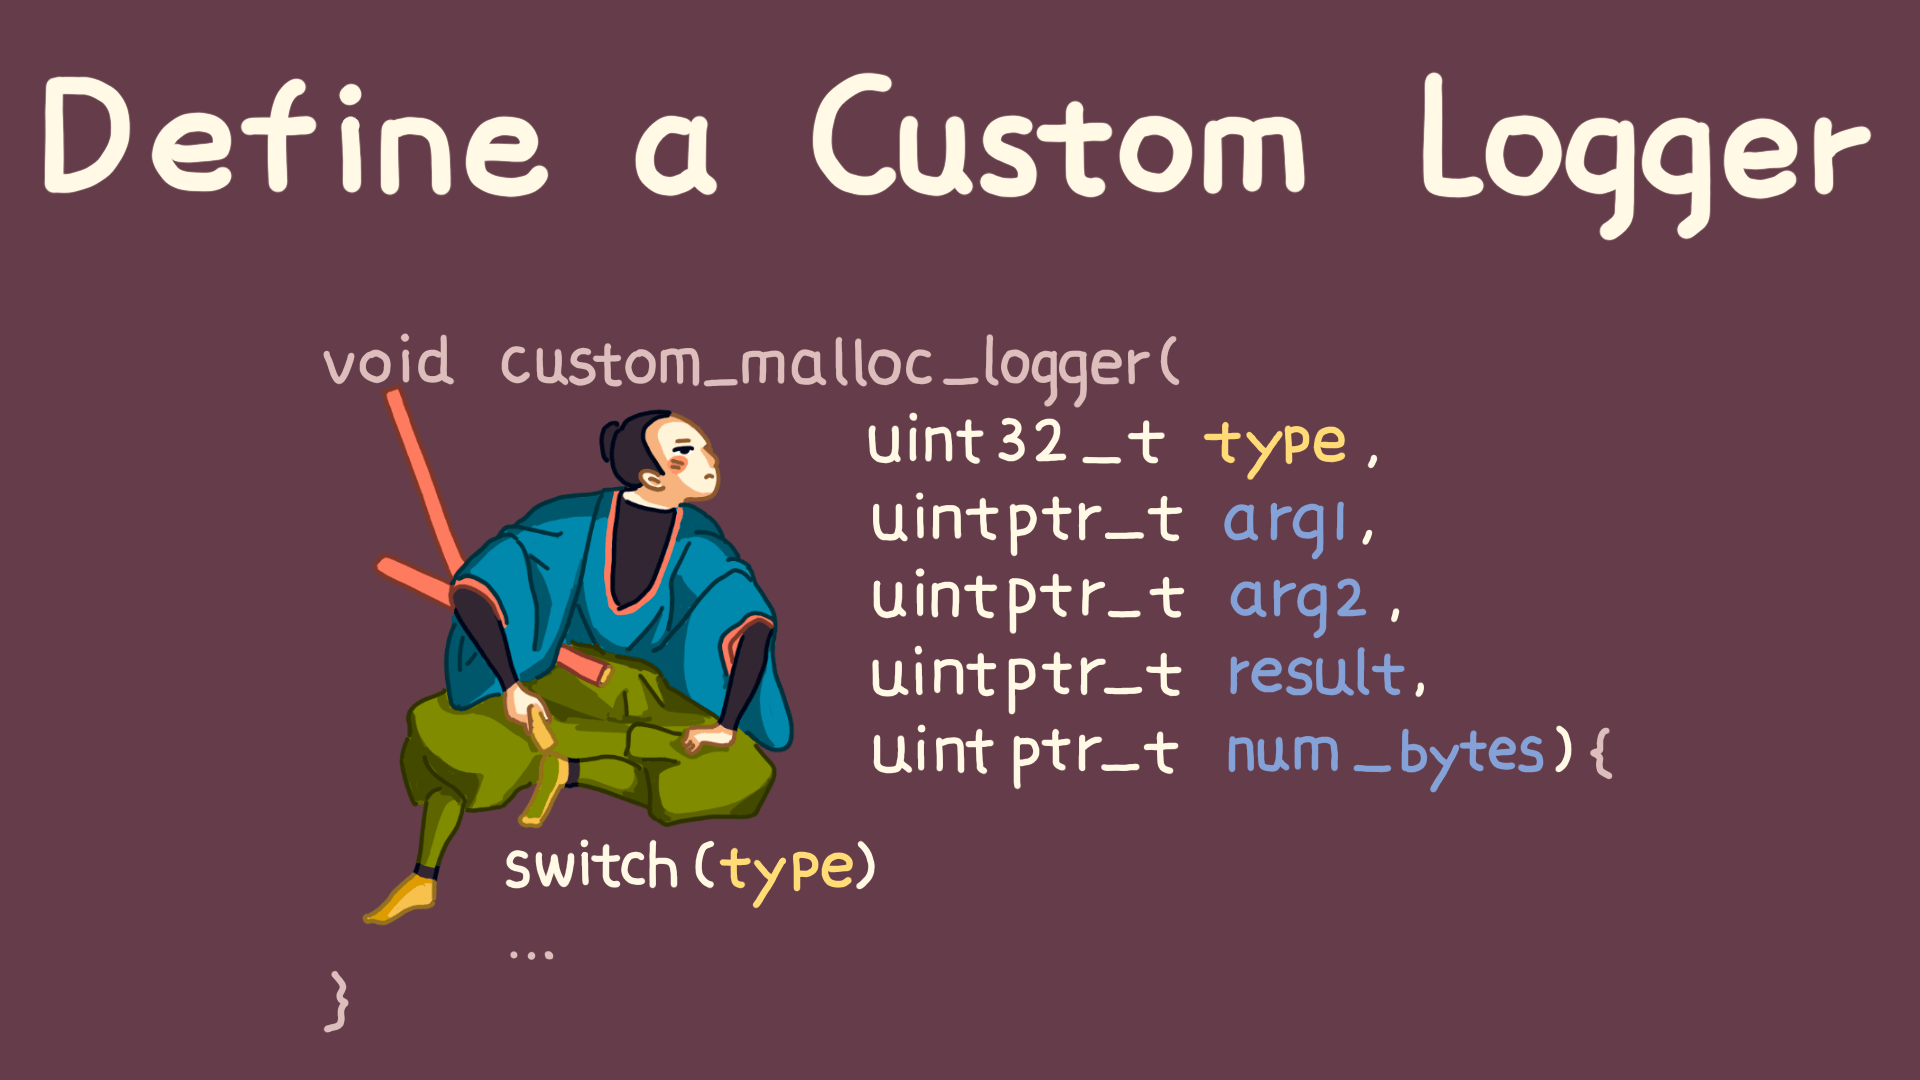
First, define a callback function with the same signature as malloc_logger, for example, custom_malloc_stack_logger.
The type indicates the type of memory operation, such as malloc, free, or realloc; arg1 represents the memory size, arg2 is the memory address, and result indicates the reallocated memory address.
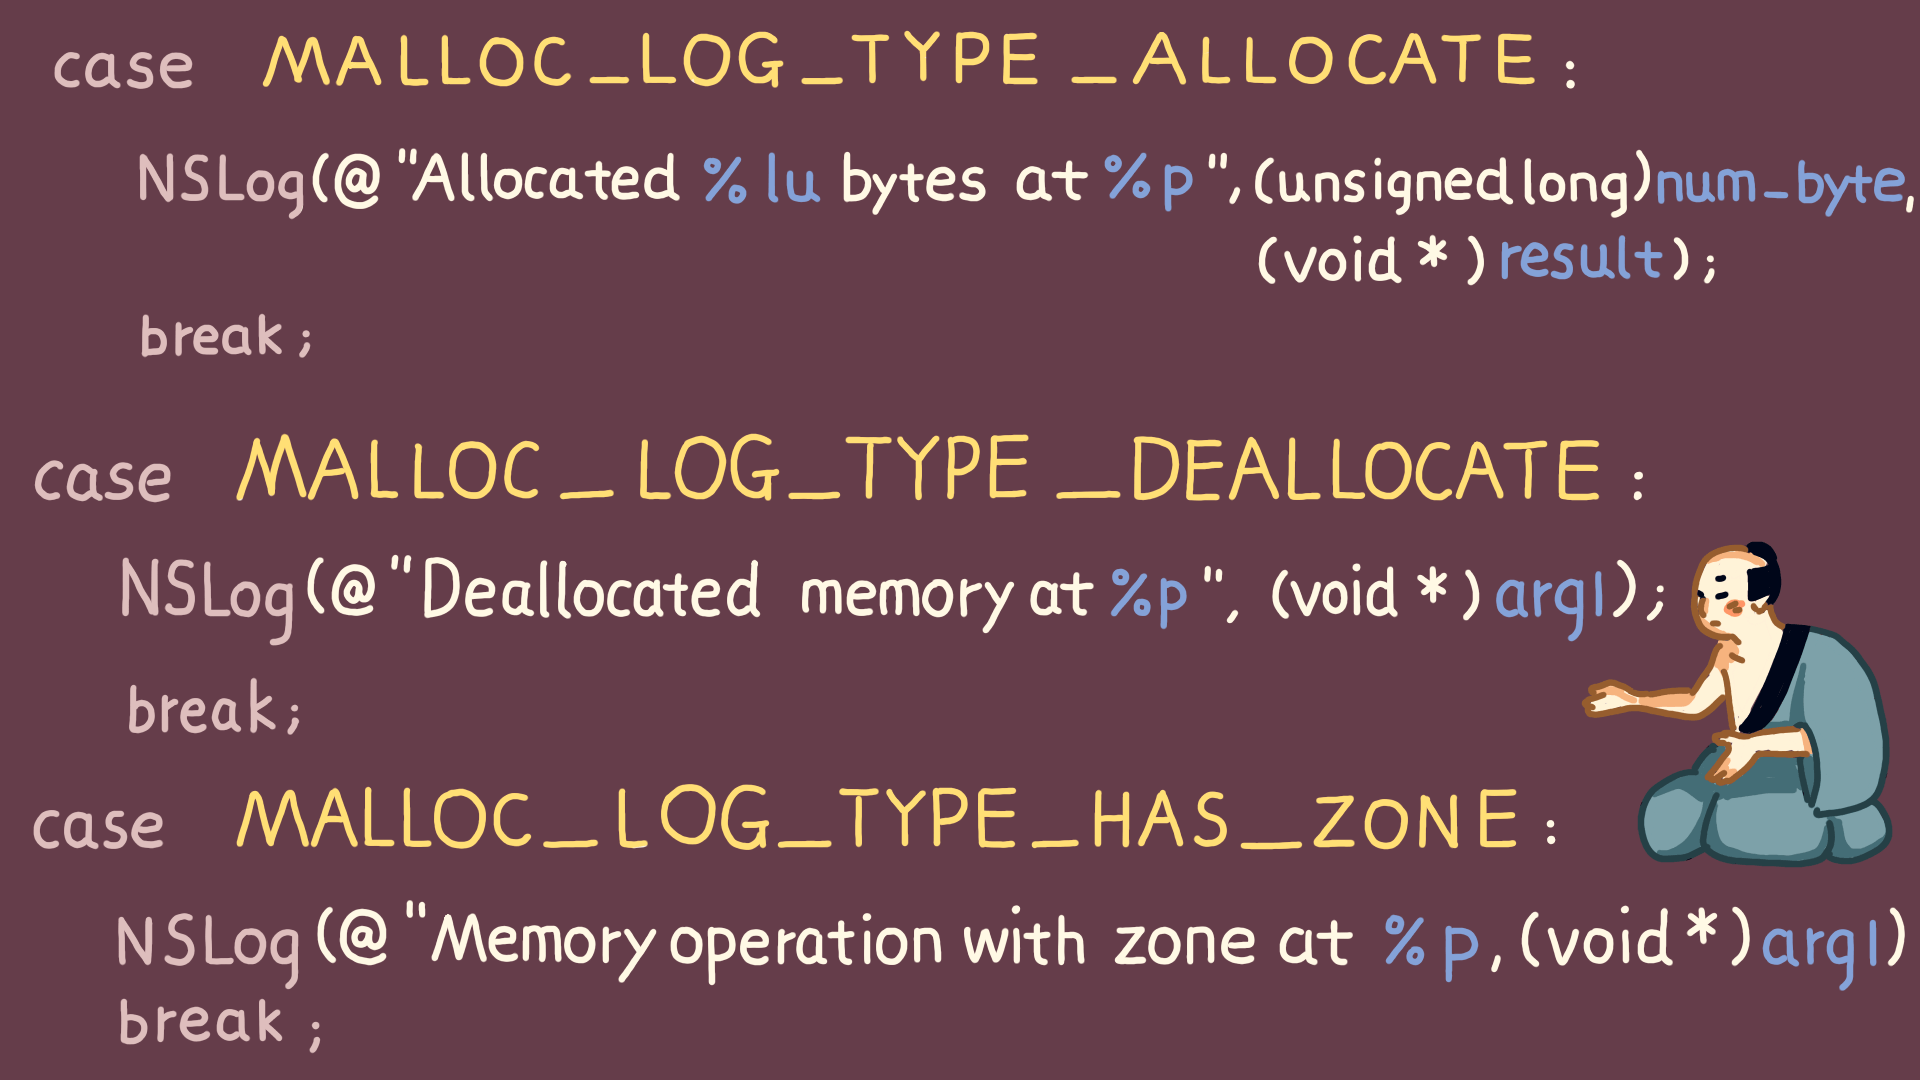
Based on different type values, we can obtain this parameter information and record memory allocation details, especially for large memory allocations. We can also capture stack information to facilitate issue analysis.

Of course, a memory snapshot is also a comprehensive solution that captures complete memory information.

First, by traversing the process’s virtual memory space, we can identify all memory regions and log information like the start address and size of each region.
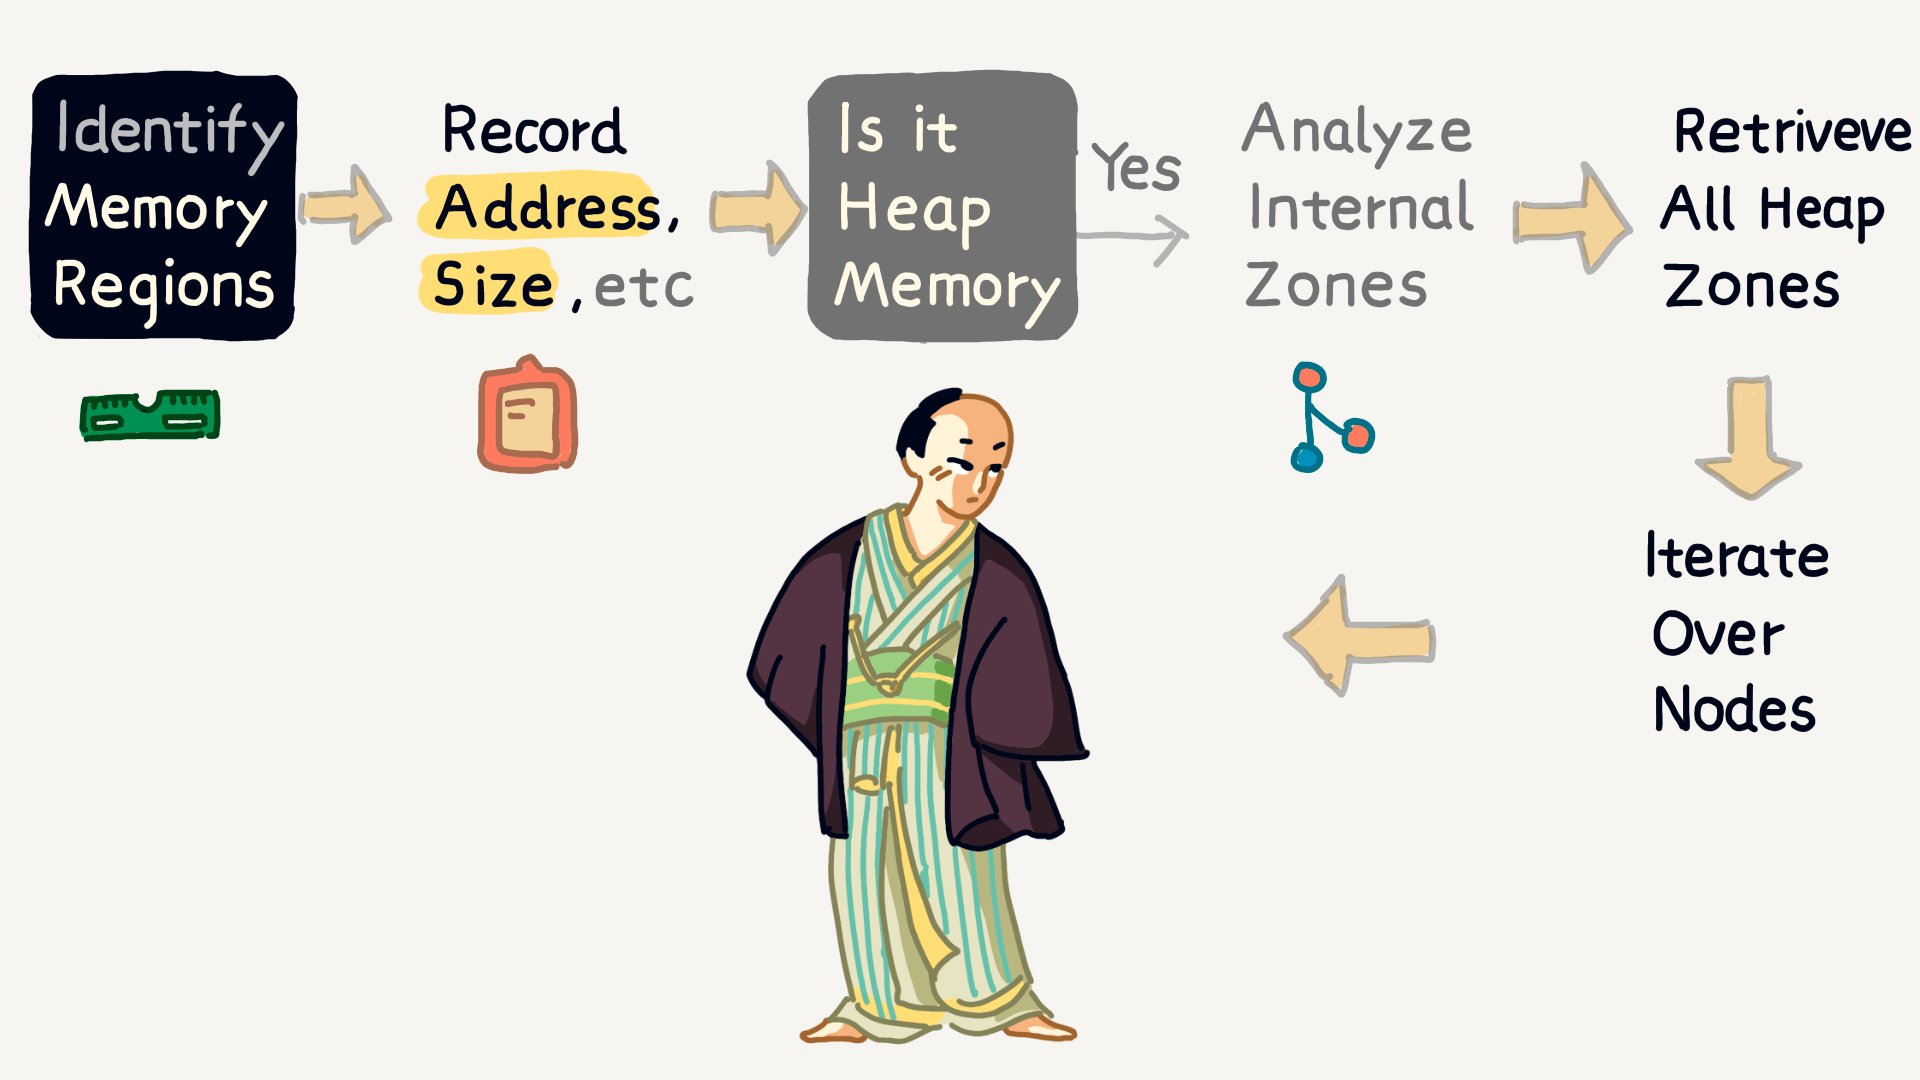
Using the malloc_get_all_zones function, we can retrieve all heap memory regions and analyze each region’s memory nodes one by one, ultimately identifying memory reference relationships.
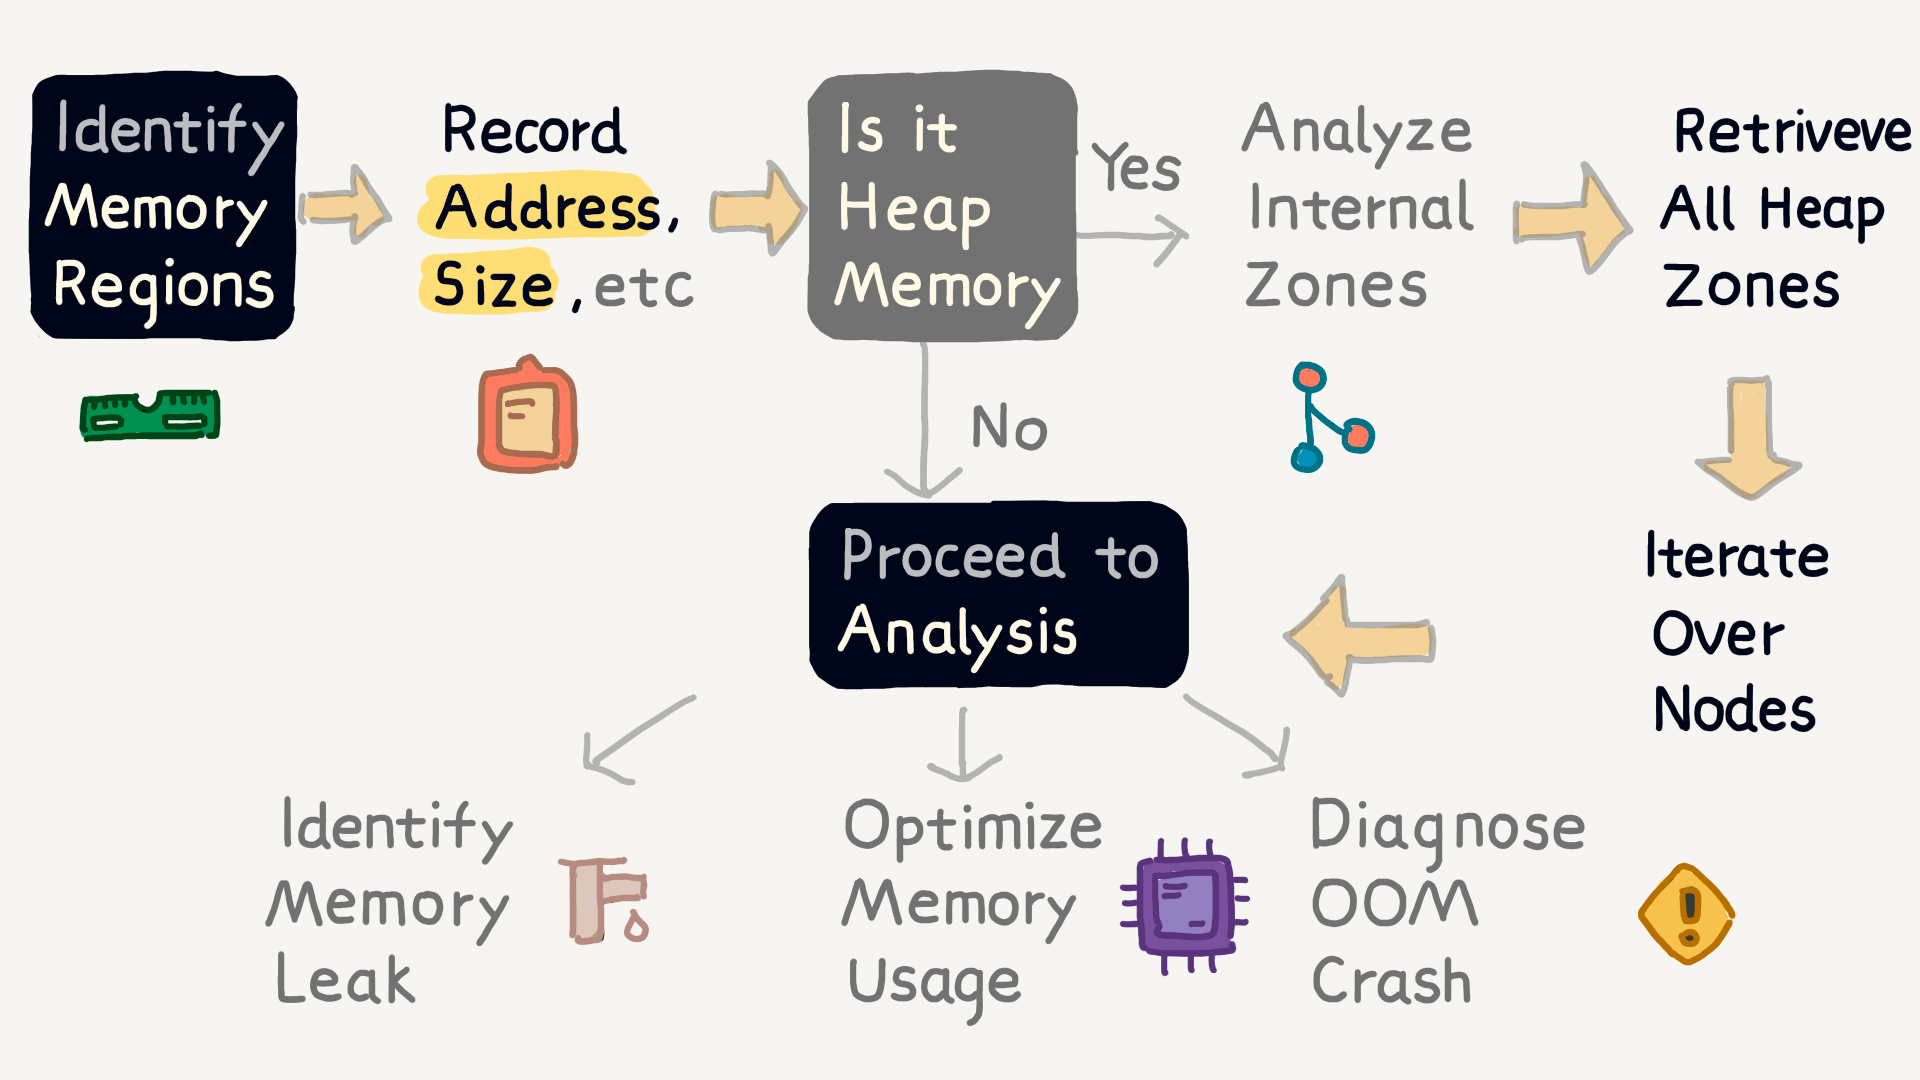
With this more comprehensive information, we can resolve memory leaks, optimize memory usage, and prevent OOM crashes in one go.
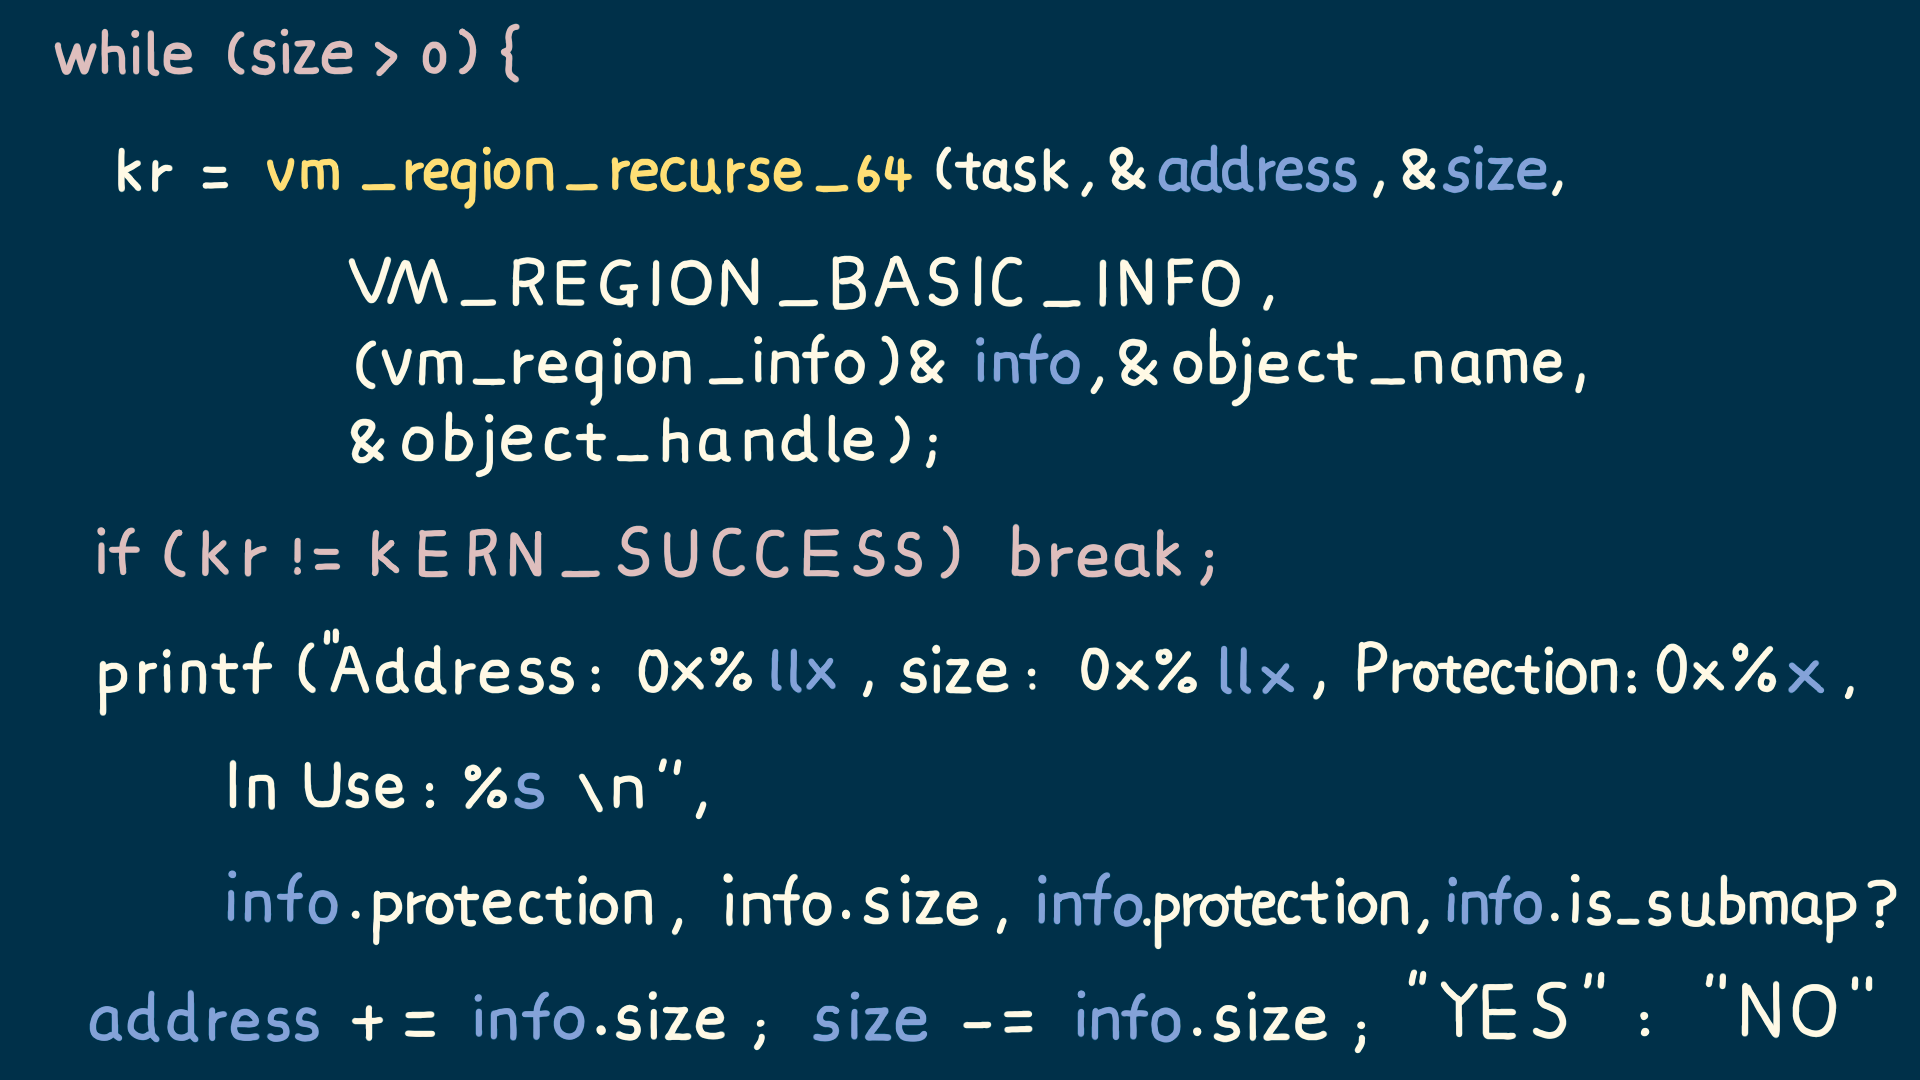
Here is a code example for finding all memory regions. As you can see, the vm_region_recurse_64 function’s info parameter contains information like the memory region’s start address and size.
Using this information, we can construct a memory layout map to analyze the app’s memory state when issues occur, such as using the protection property to check if the app accessed unreadable or unwritable memory regions.
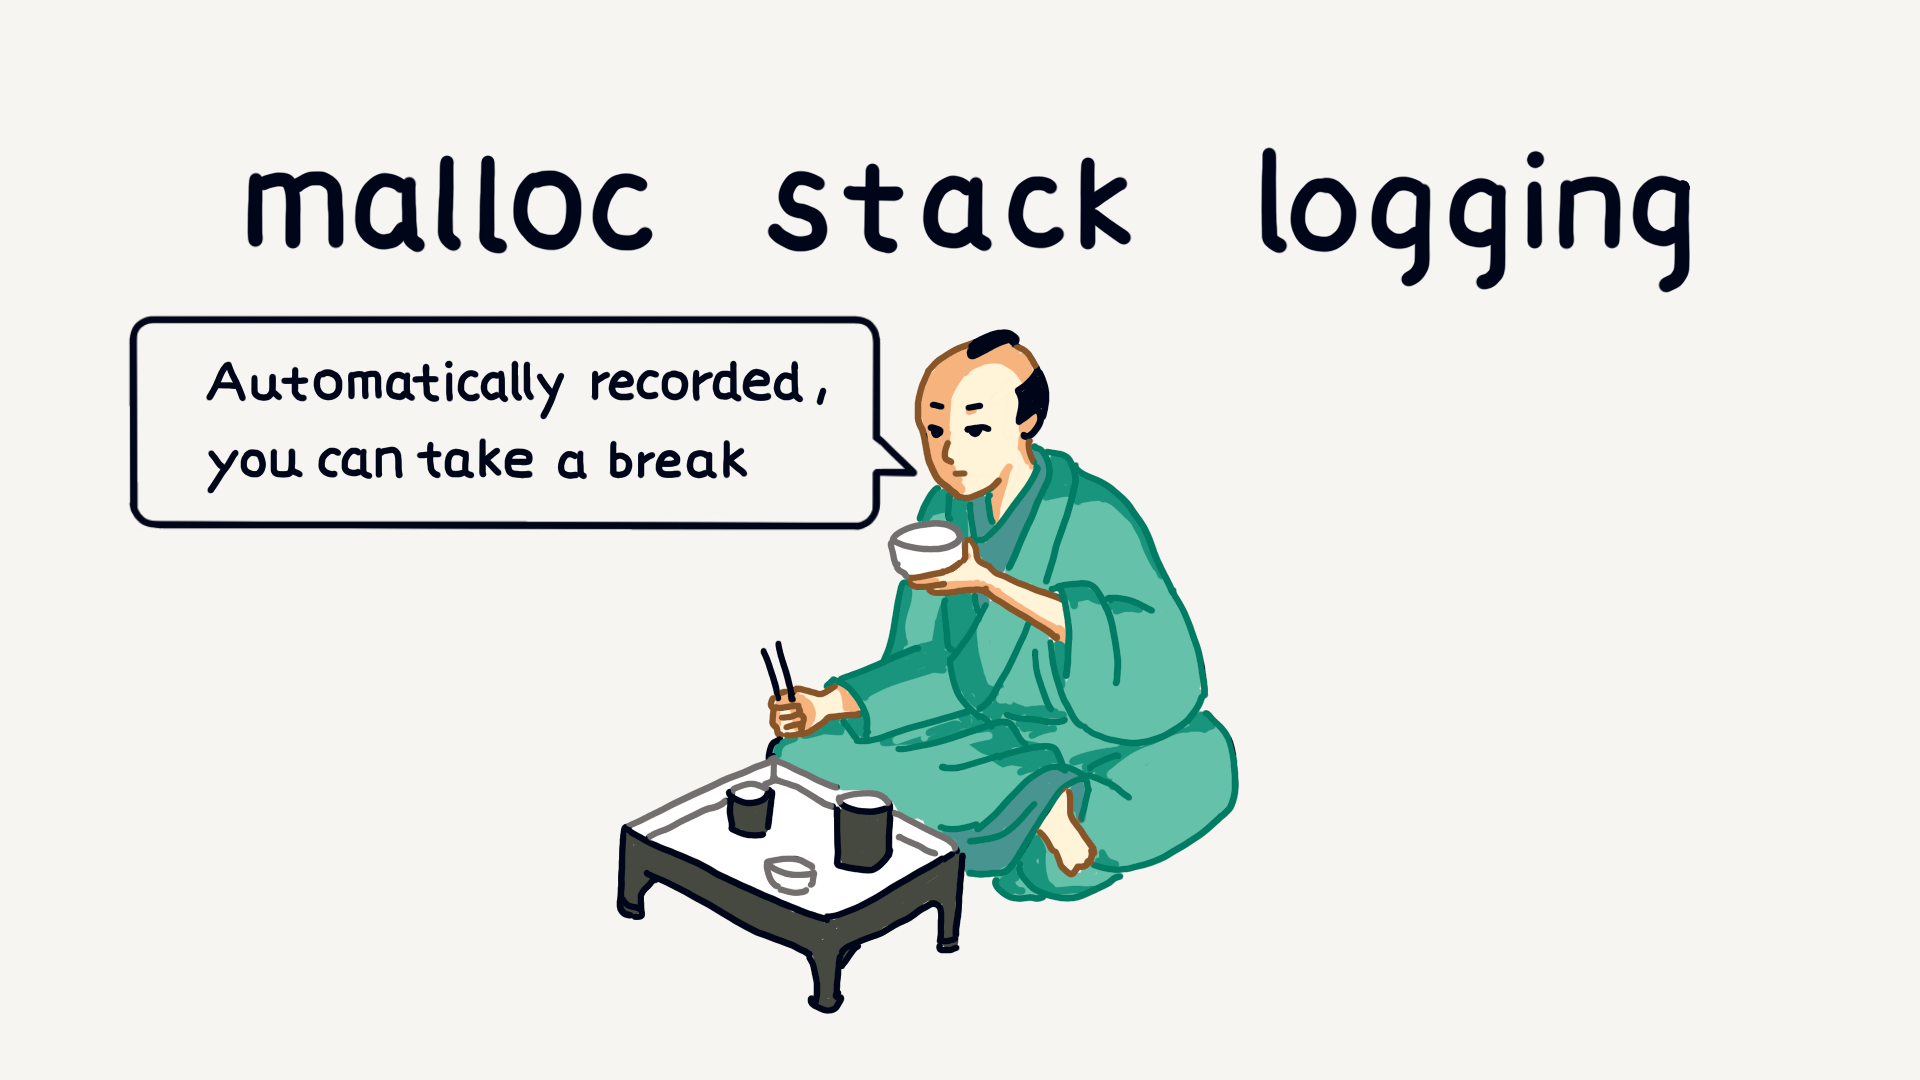
Compared to other methods, the benefit of malloc stack logging is that it automatically records data without needing to write code manually to capture memory information. You just need to enable it when necessary and disable it when not.
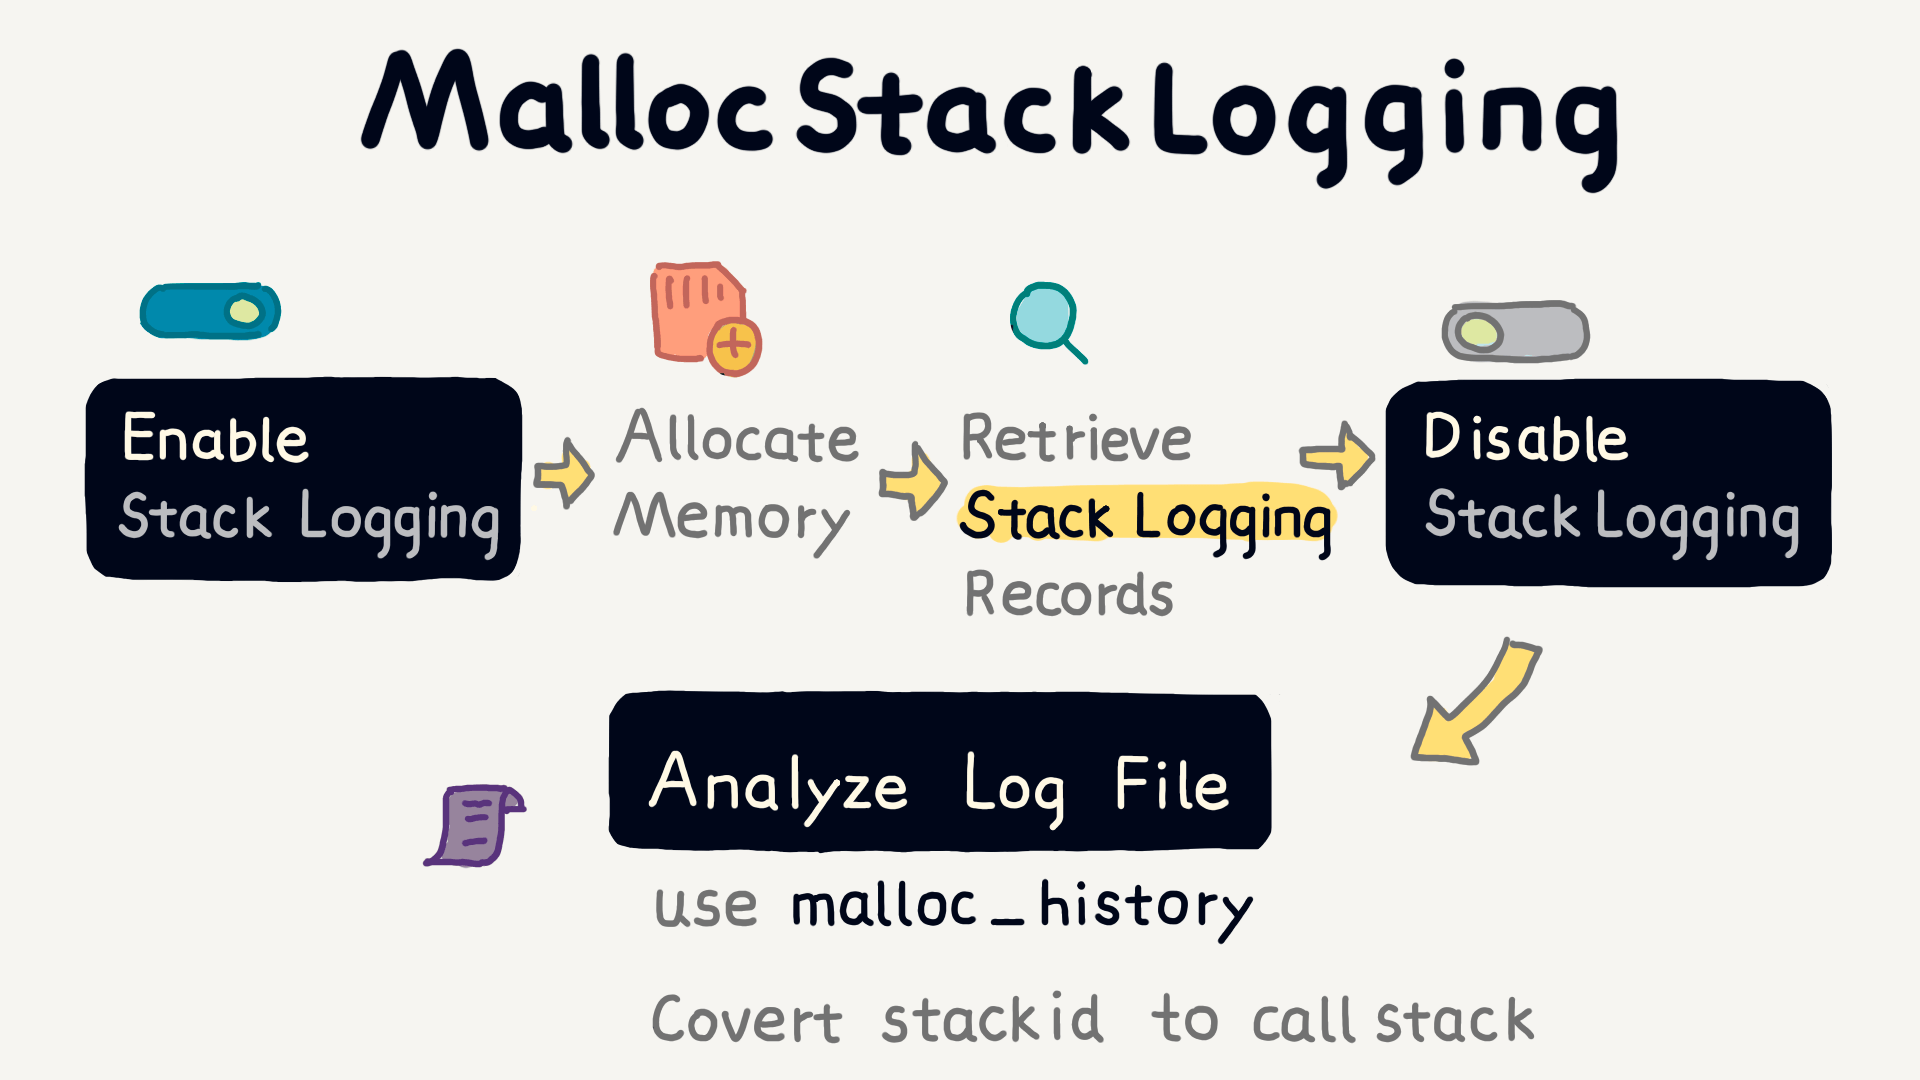
MallocStackLogging records every memory allocation, release, and reference count change. These logs can be analyzed with the system tool leaks to identify unreleased memory or with the malloc_history tool to translate stack IDs in the logs into readable stack trace information.
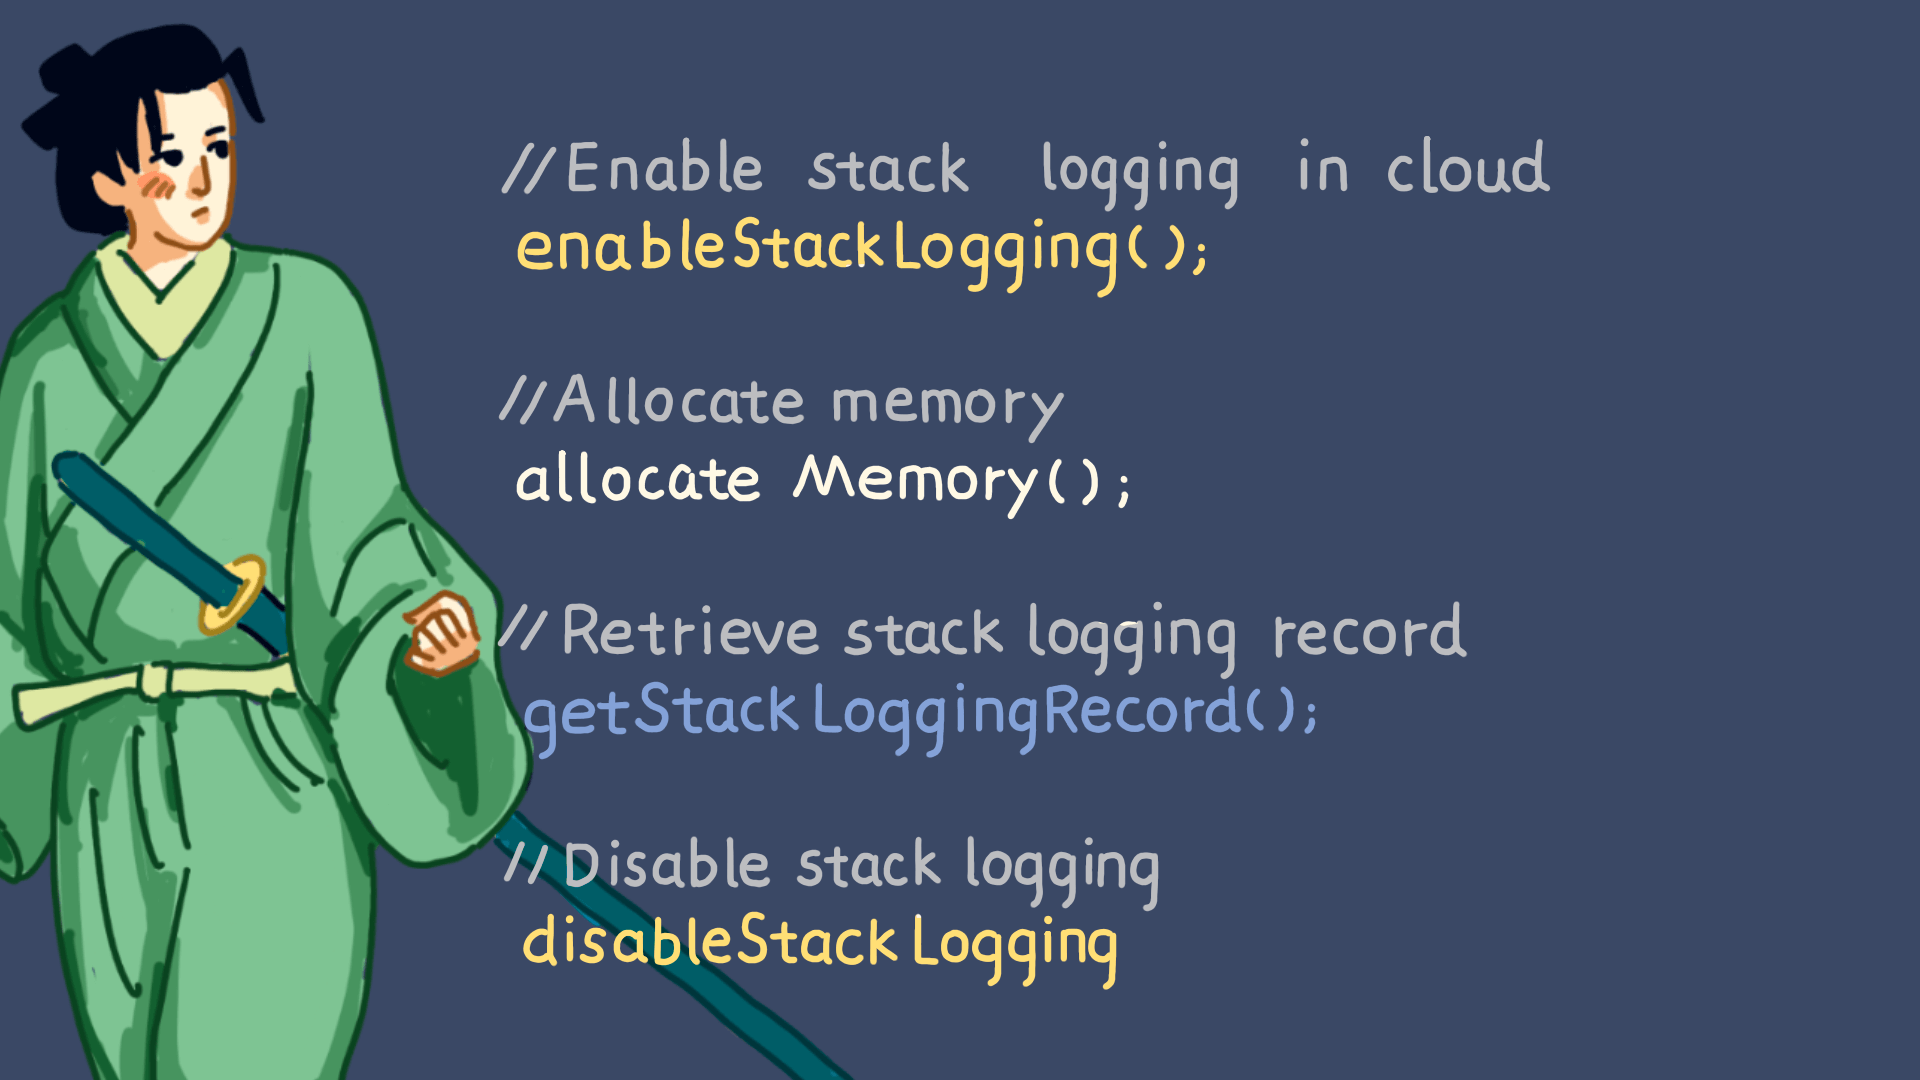
Here is an example code for using MallocStackLogging. We can use the enableStackLogging function to enable logging, disableStackLogging to disable logging, and getStackLoggingRecords to retrieve current memory operation details.
In the enableStackLogging function, turn_on_stack_logging is called to enable logging. disableStackLogging calls turn_off_stack_logging to disable logging. getStackLoggingRecords calls mach_stack_logging_enumerate_records and mach_stack_logging_frames_for_uniqued_stack to record the details of current memory operations.

The tools we used earlier, leak and malloc_history for analyzing MallocStackLogging logs, both come from the malloc library. The malloc library provides many tools for debugging memory.

In addition to MallocStackLogging, the system offers many tools for debugging memory, such as Guard Malloc and some environment variables and command-line tools.
The MallocScribble environment variable can detect memory corruption errors.

We’ve talked a lot about how to solve problems when they occur, but is there a way to optimize memory before problems even arise?

In fact, iOS itself evolves to optimize memory management. Especially in iOS, which is designed for mobile devices without swap partitions like desktop systems, it uses the Jetsam mechanism to help developers manage memory proactively when resources are tight.
Additionally, the system provides tools like thread-local storage and mmap(), which are methods that can improve memory efficiency.
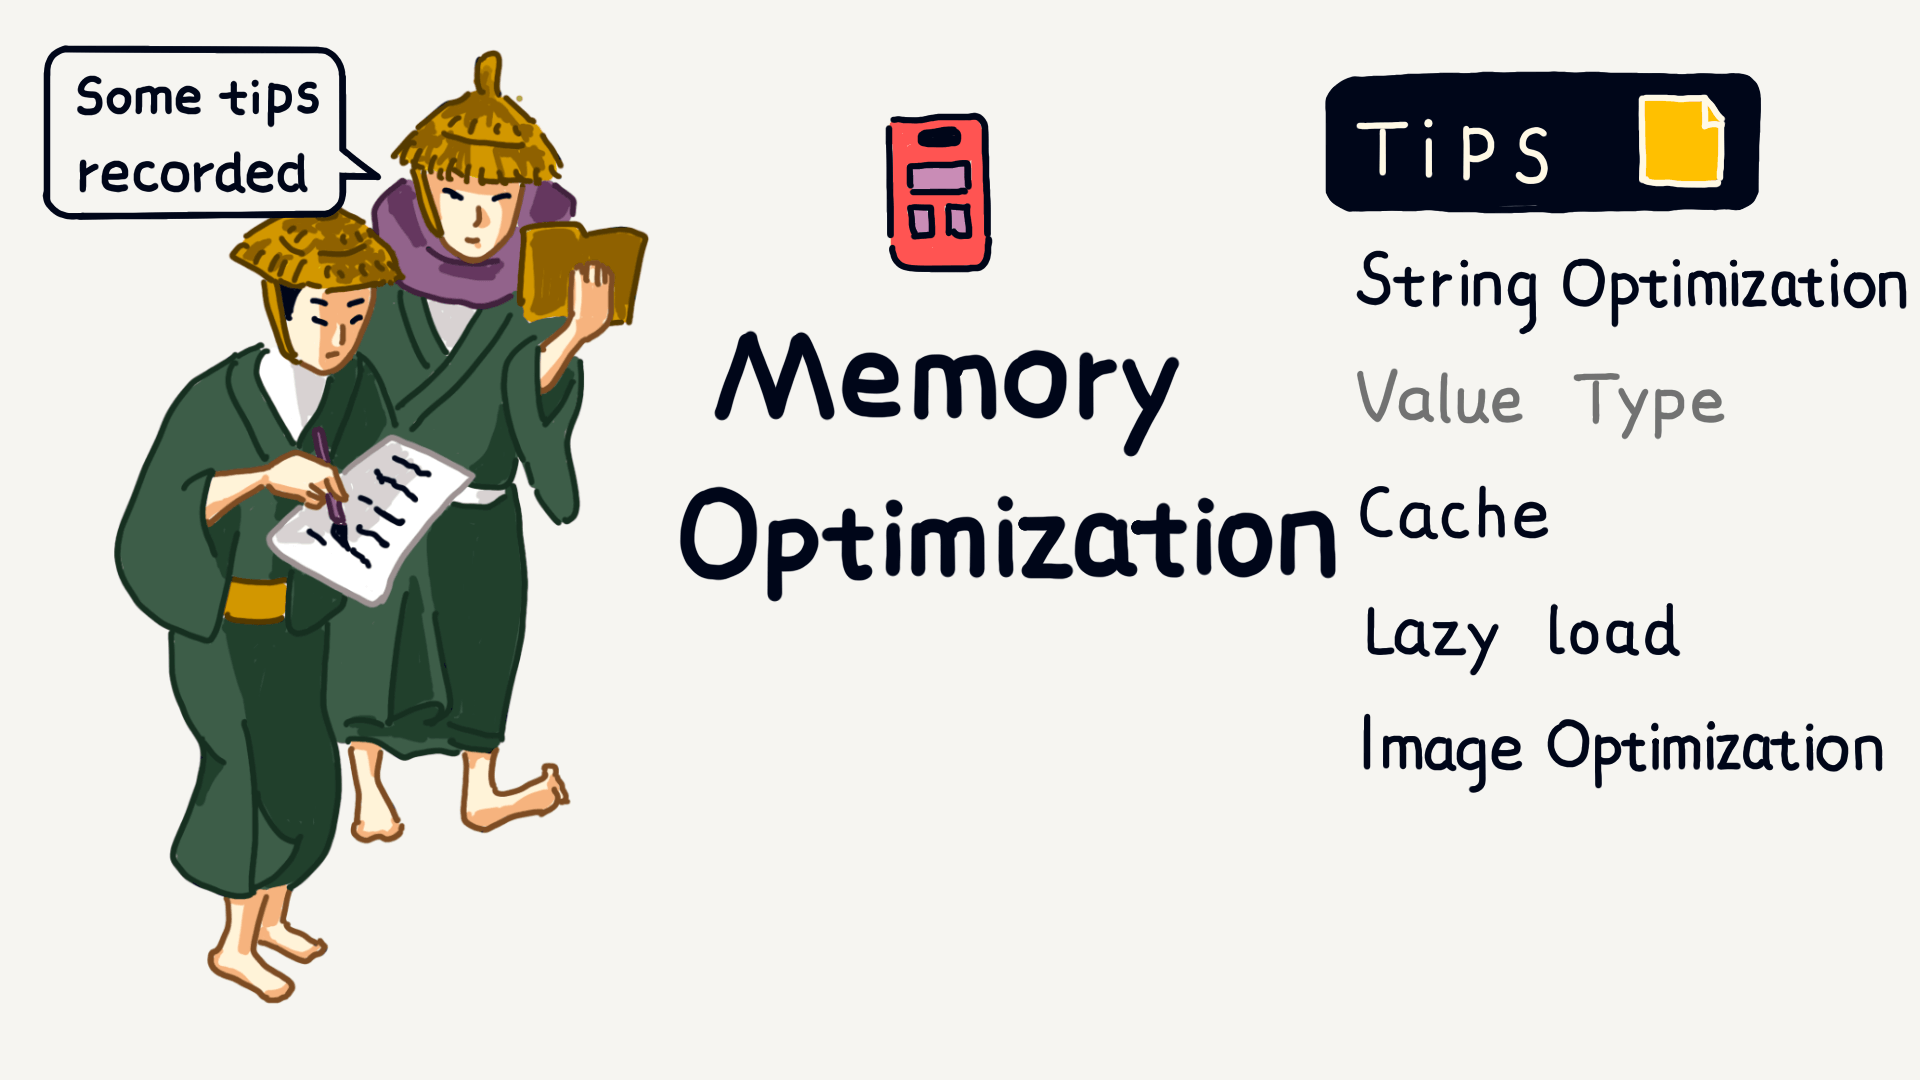
Here are a few tips to help reduce unnecessary memory overhead:
- Take advantage of the copy-on-write principle and avoid frequently modifying large strings.
- Use value types as much as possible to avoid unnecessary object creation.
- Make good use of caching and lazy loading.
- Choose appropriate image formats and control image resolution and file size.
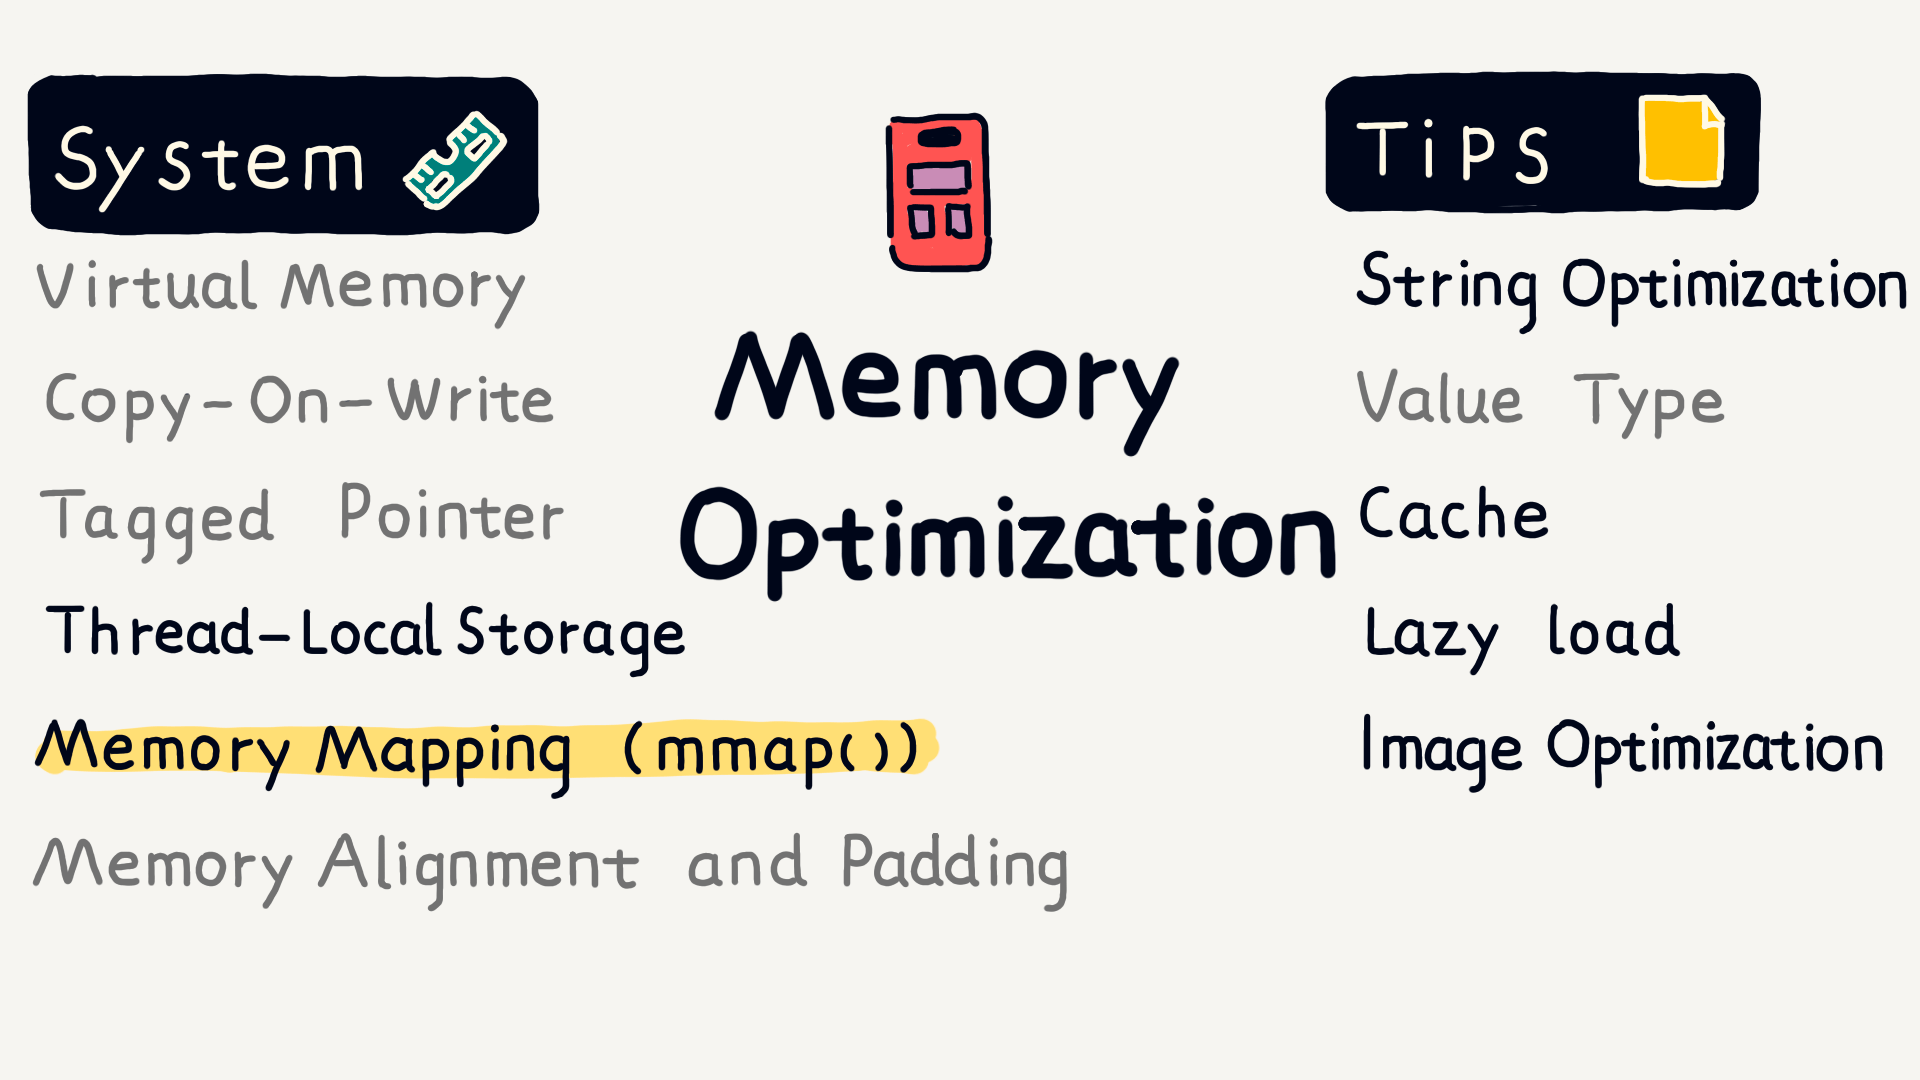
These are some of the optimizations the system does for you, but there are plenty of areas where we can optimize as well.

A slow app launch can be a frustrating experience. We all know that this is a big issue.
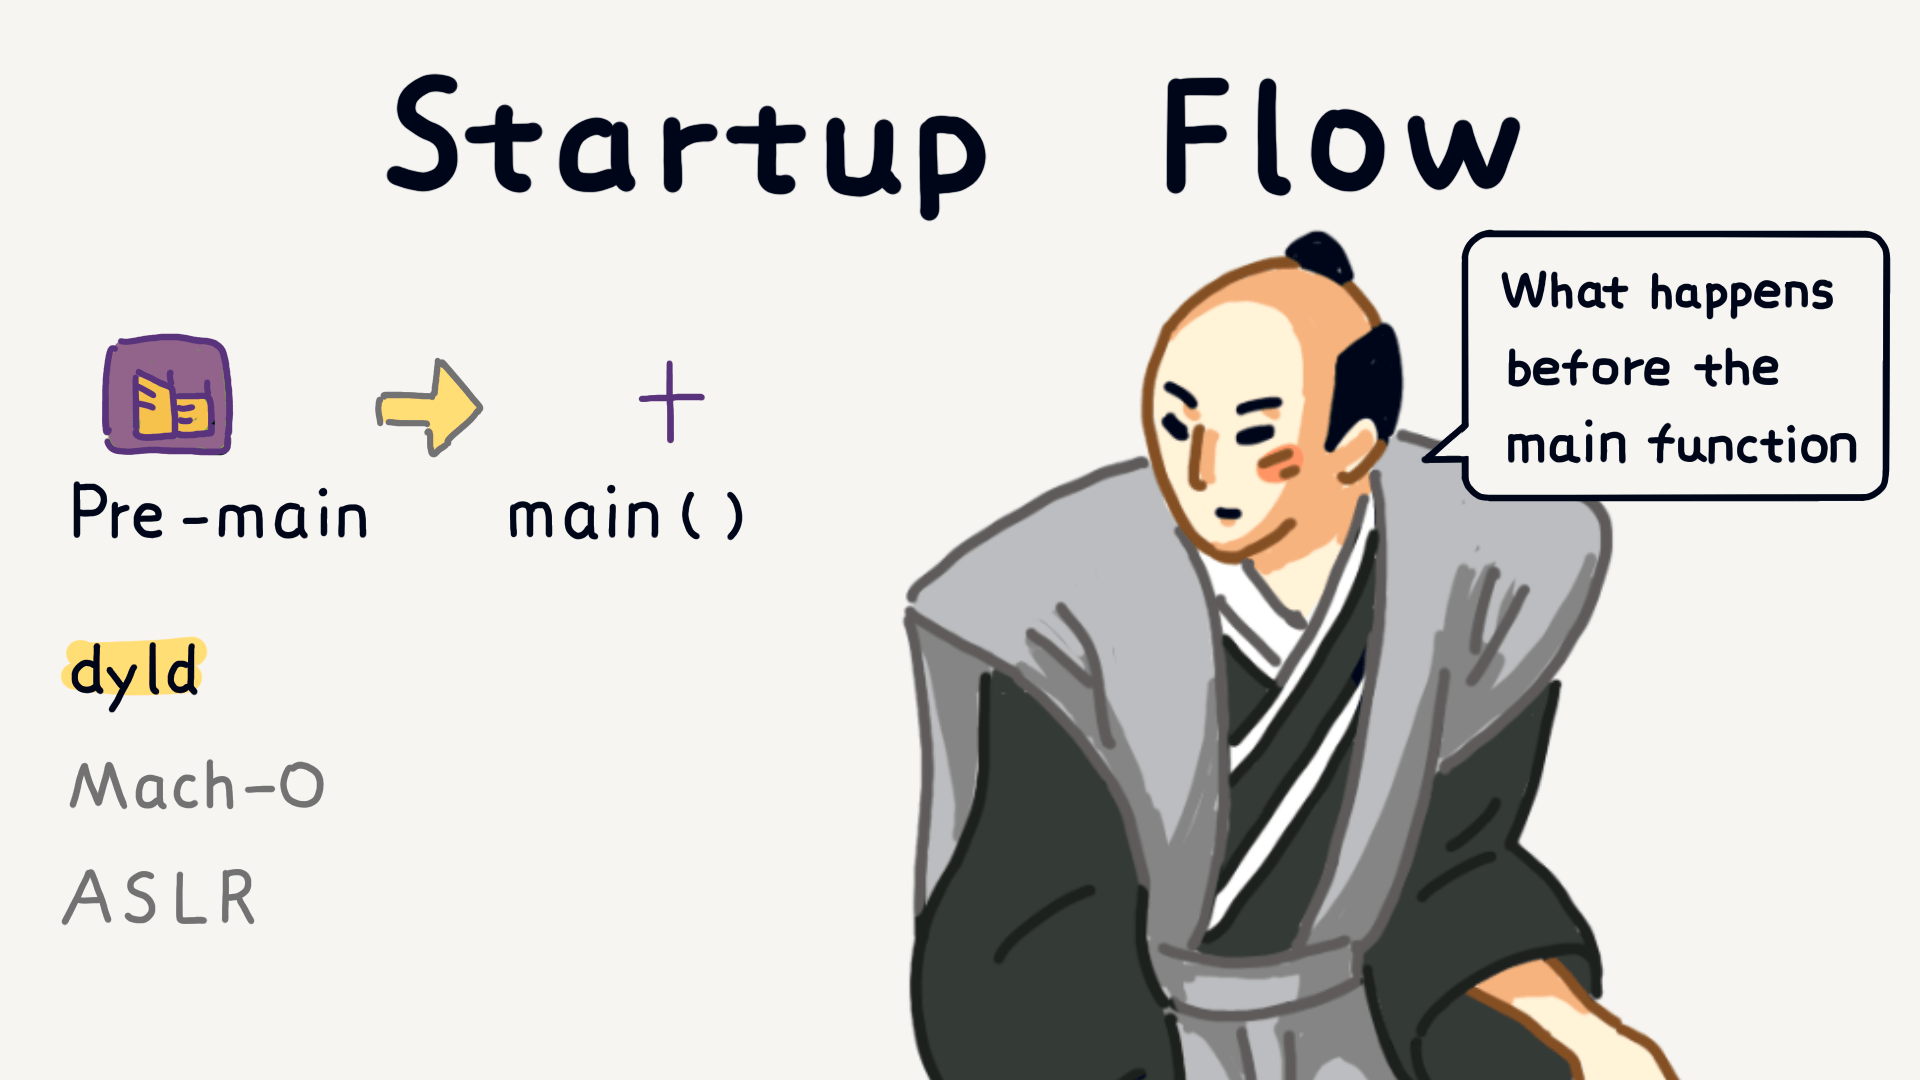
App launch actually happens in several stages. The first stage is called Pre-main, which refers to things the system does before the main() function executes, like loading app code, the dynamic linker working, Address Space Layout Randomization (ASLR), and some initialization operations.
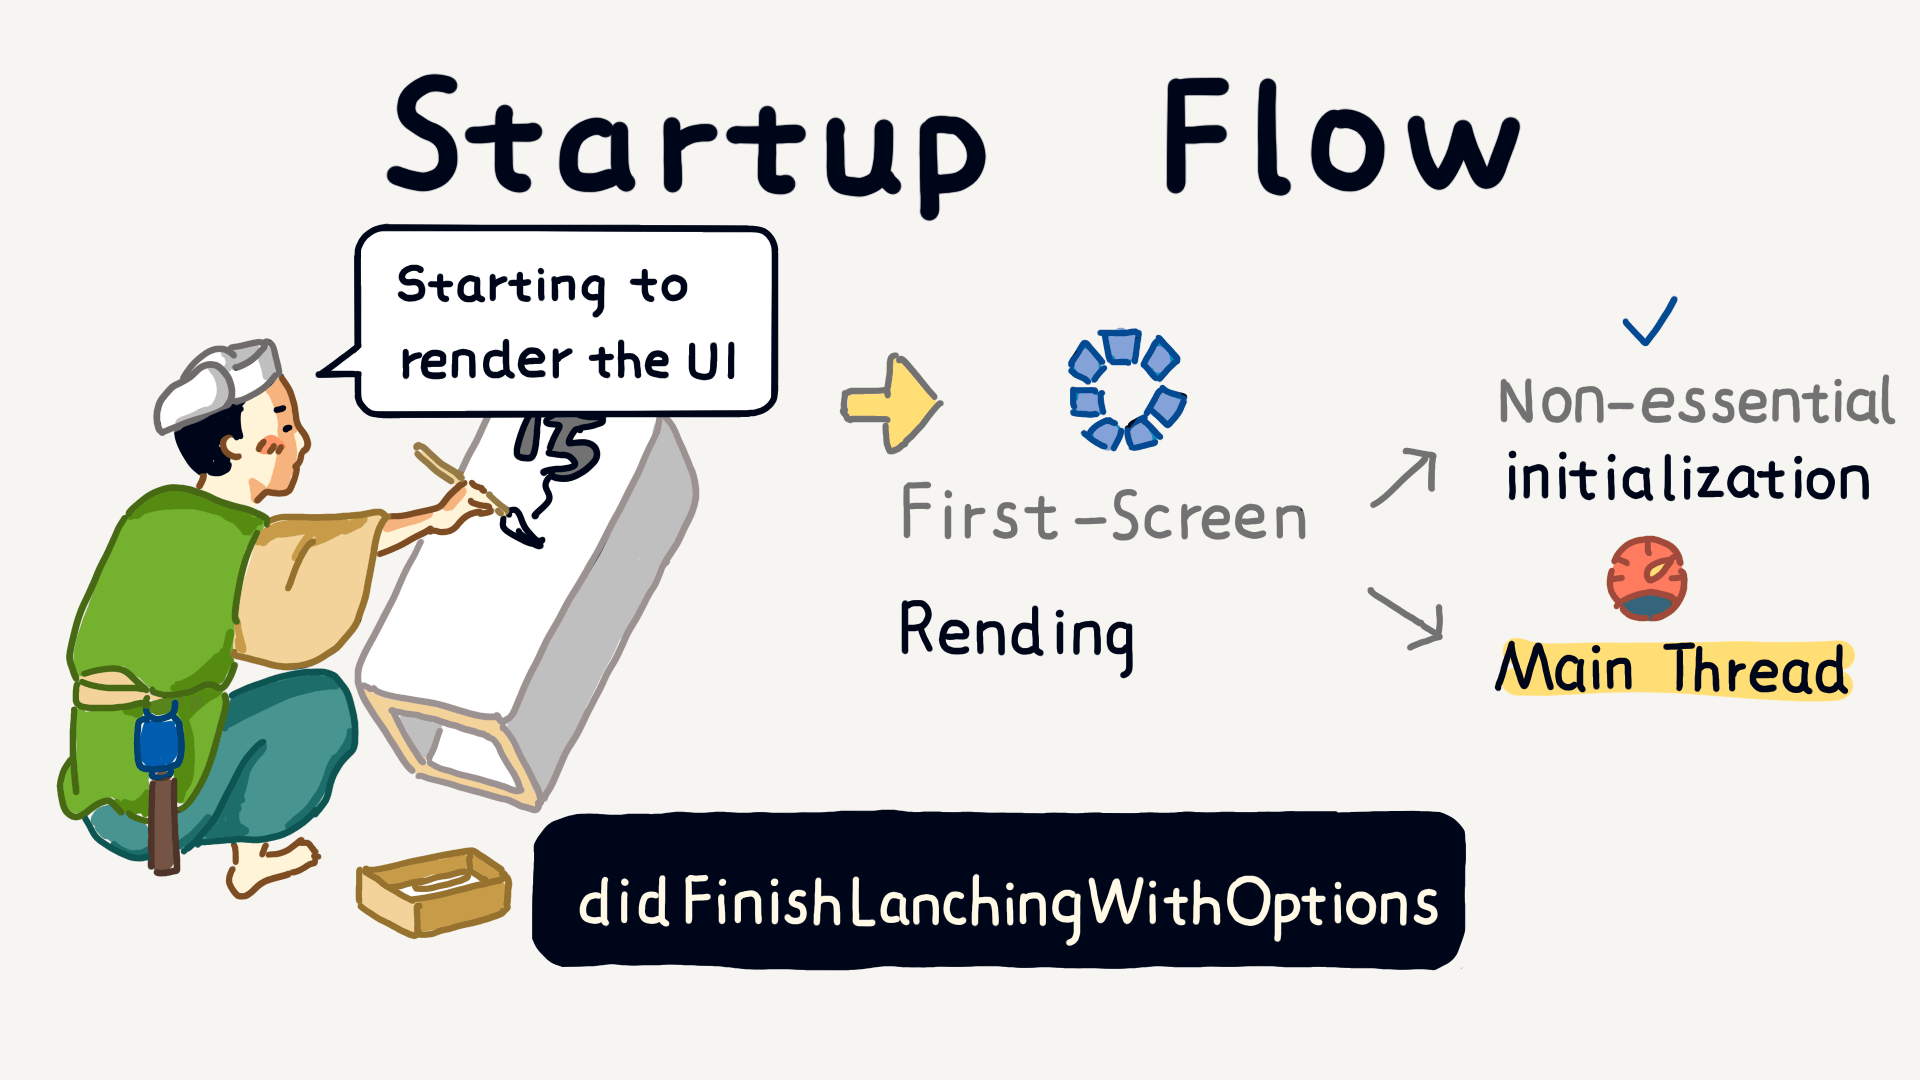
After these preparations are done, the app truly starts running and enters the UI rendering stage, where tasks in didFinishLaunchingWithOptions begin executing. These tasks include both the main thread’s work and operations on other threads.
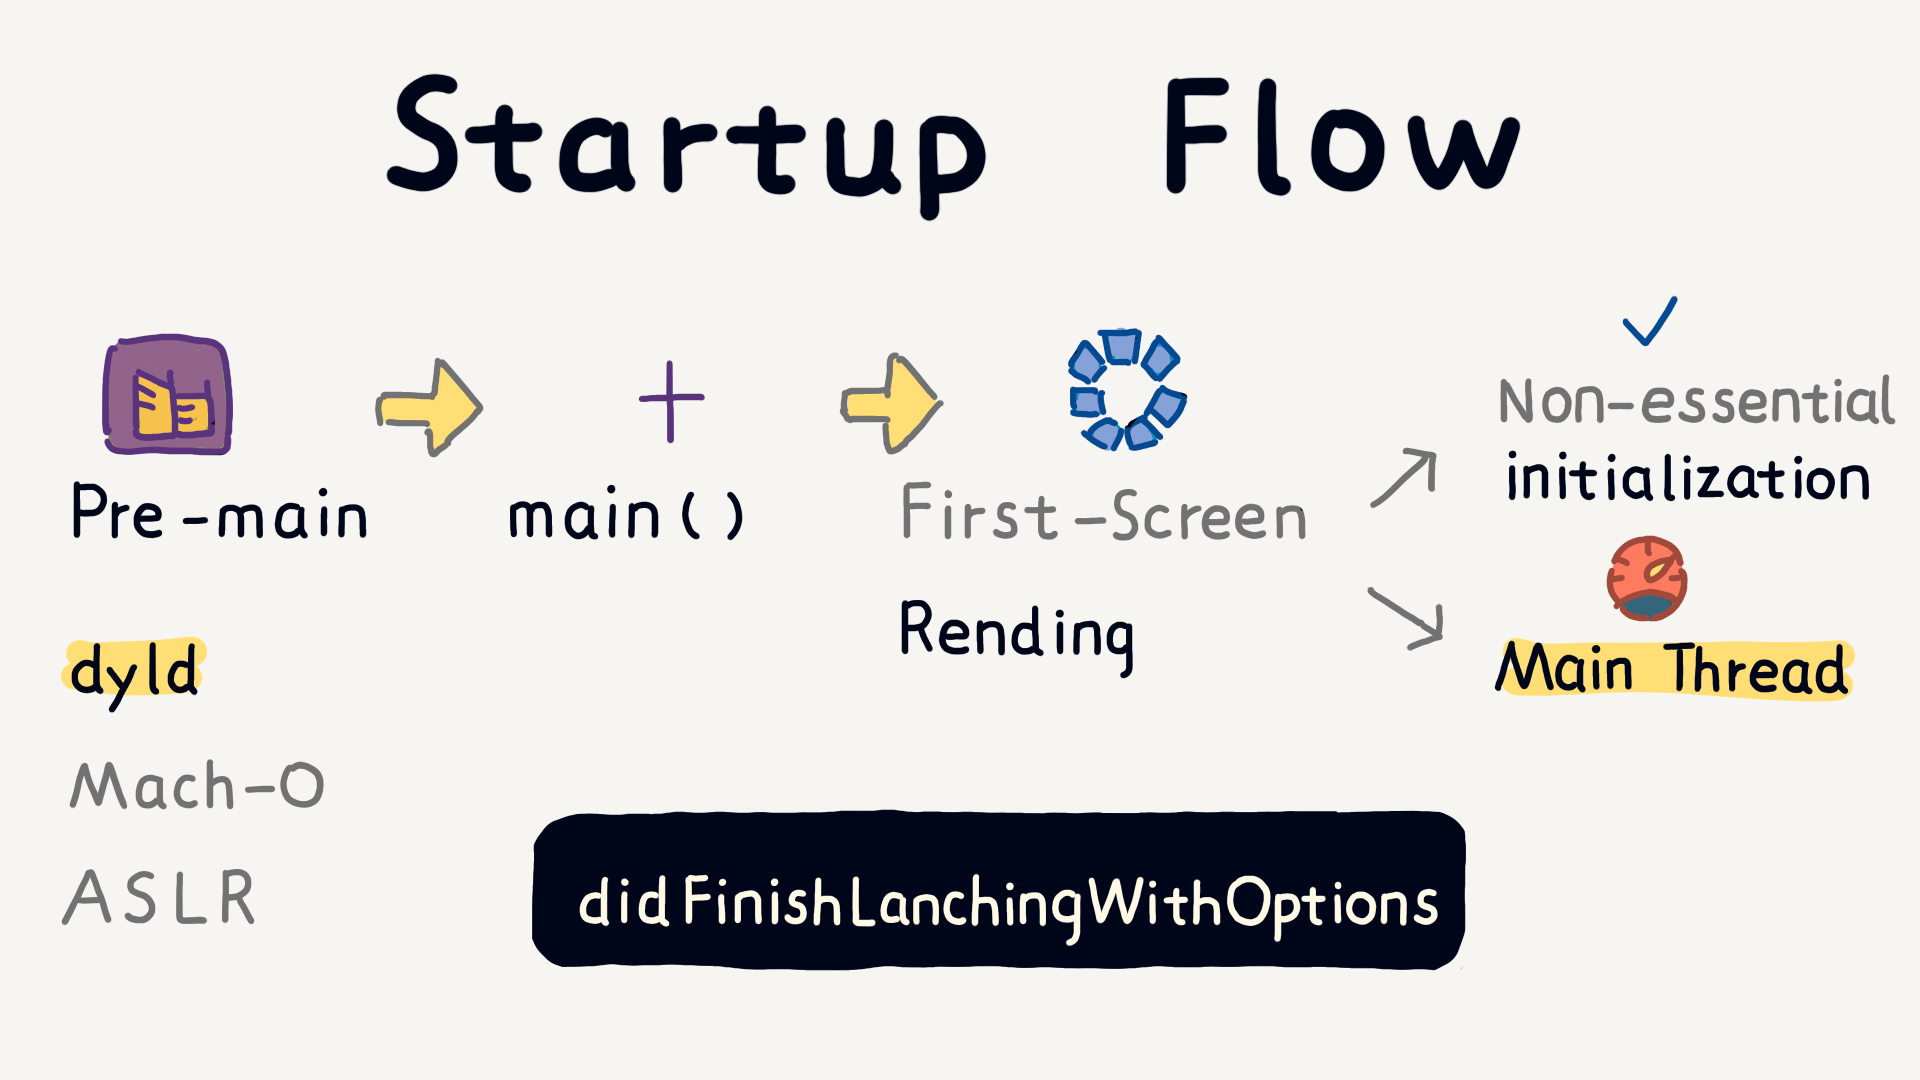
To summarize, app launch is a multi-stage process. From Pre-main to UI rendering, tasks must be properly arranged, and neither the main thread nor background threads should waste resources.
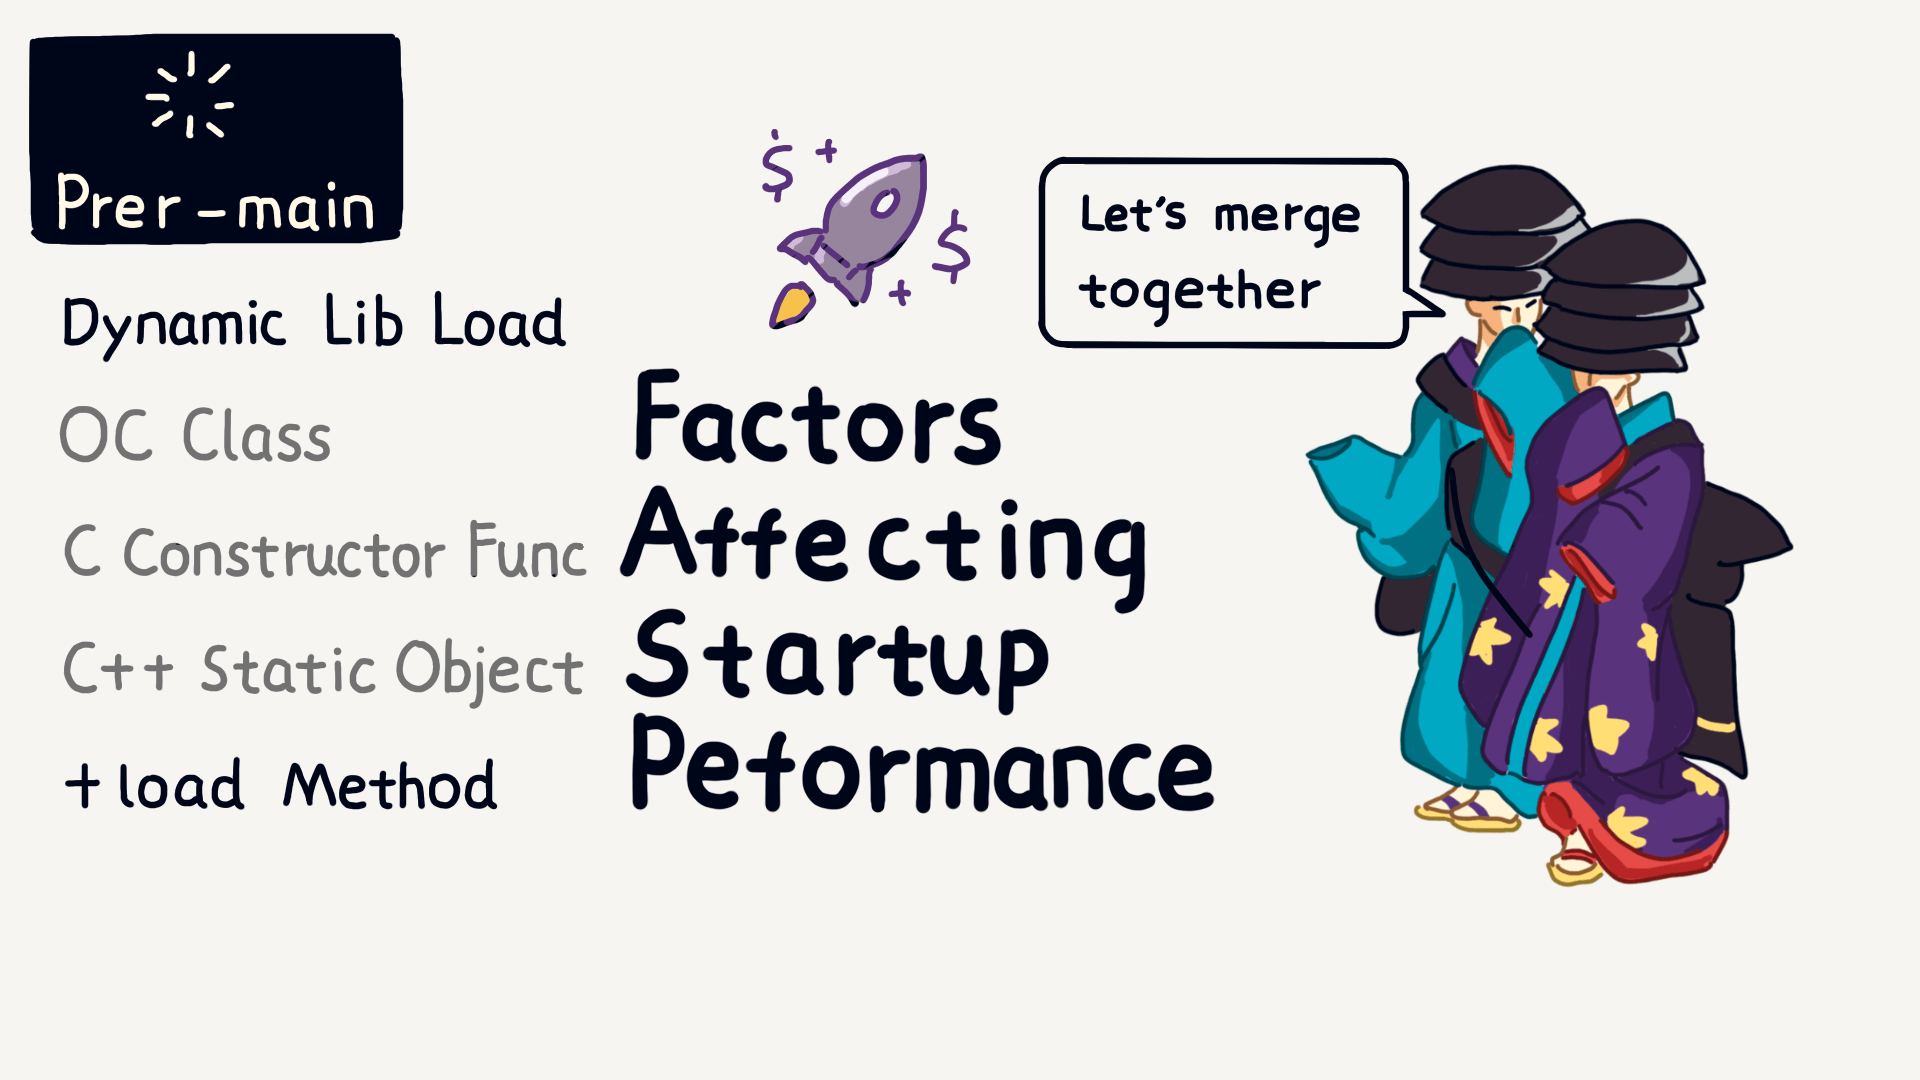
Next, let’s talk about factors affecting launch performance. In the Pre-main stage, the number of dynamic libraries, the number of ObjC classes, the number of C constructors, the number of C++ static objects, and ObjC’s +load methods all directly impact launch speed. Simply put, the fewer, the better.
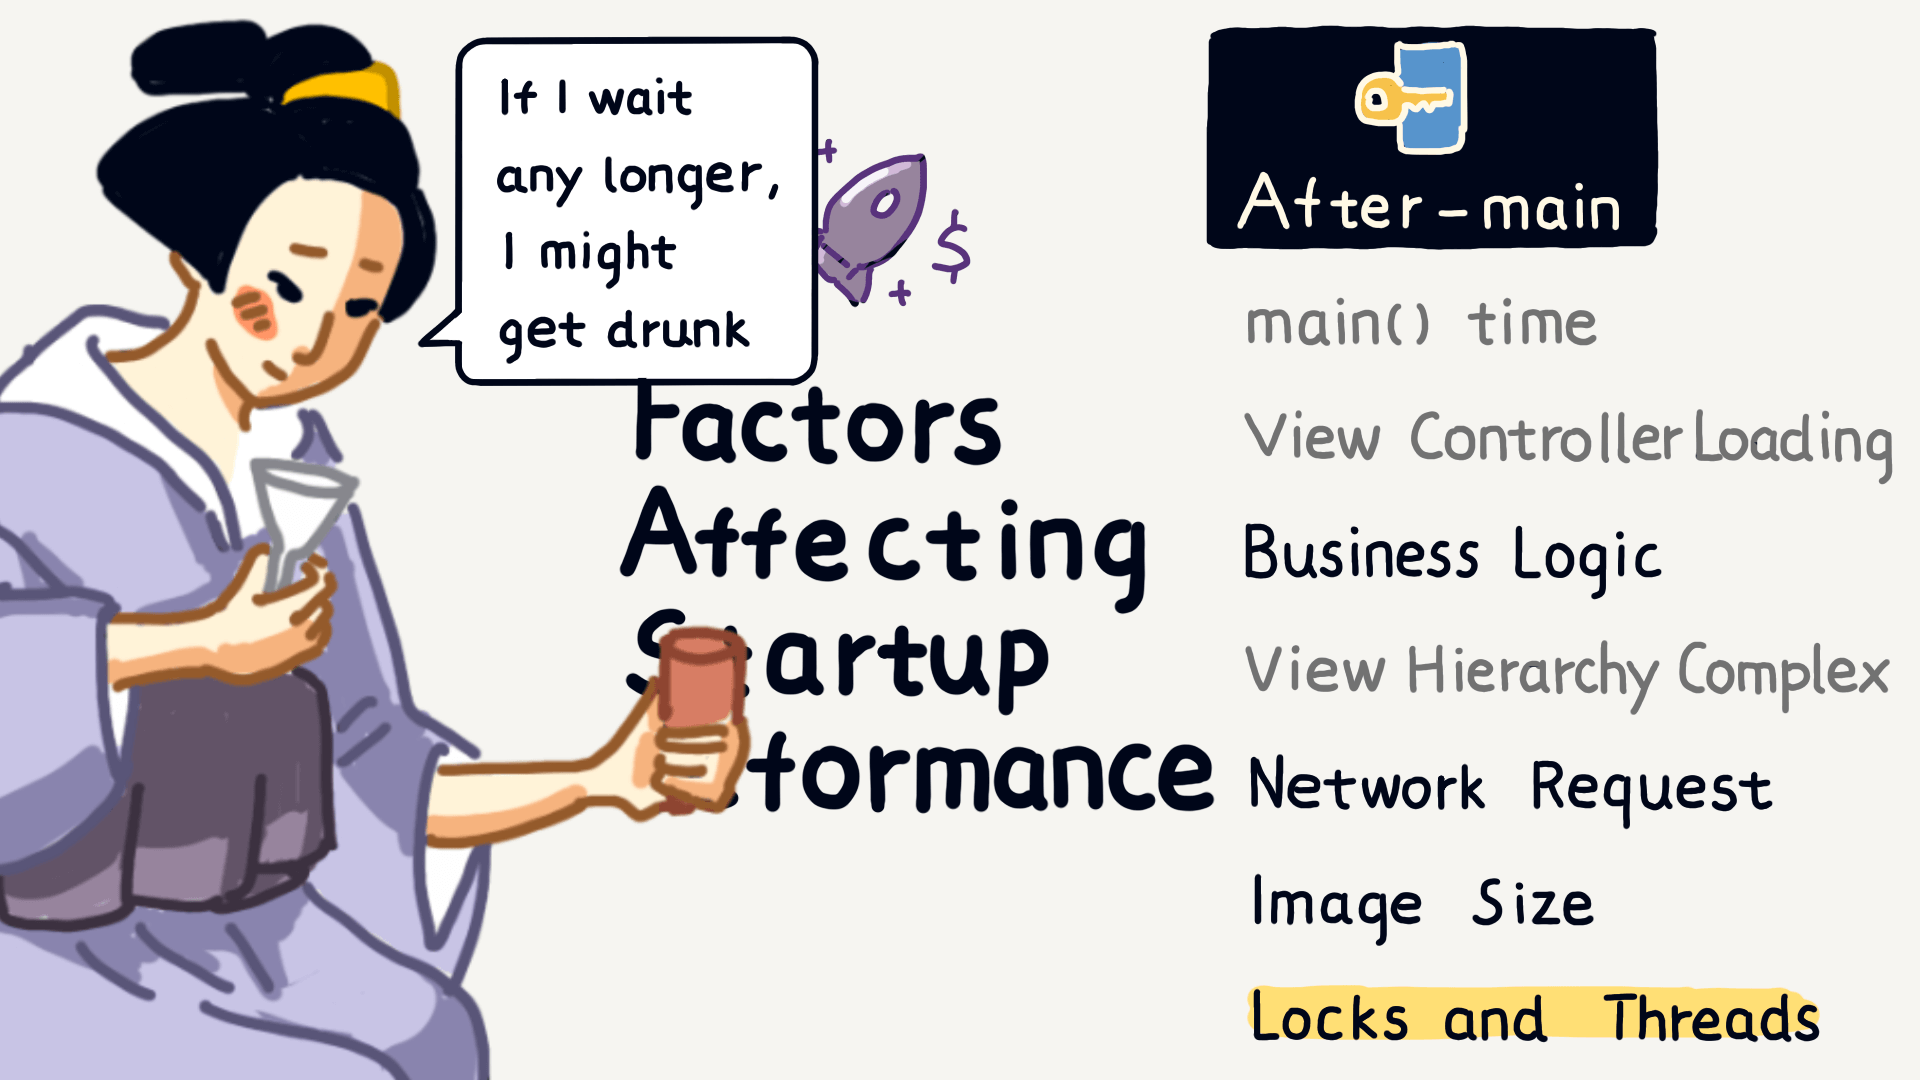
After the main() function is executed, even more factors can affect the launch time, such as main() execution time, time spent in applicationWillFinishLaunching, view controller loading speed, business logic execution efficiency, the complexity of view hierarchy, number and speed of network requests, size of resource files, usage of locks, thread management, and time-consuming method calls—all of which can slow down the launch.
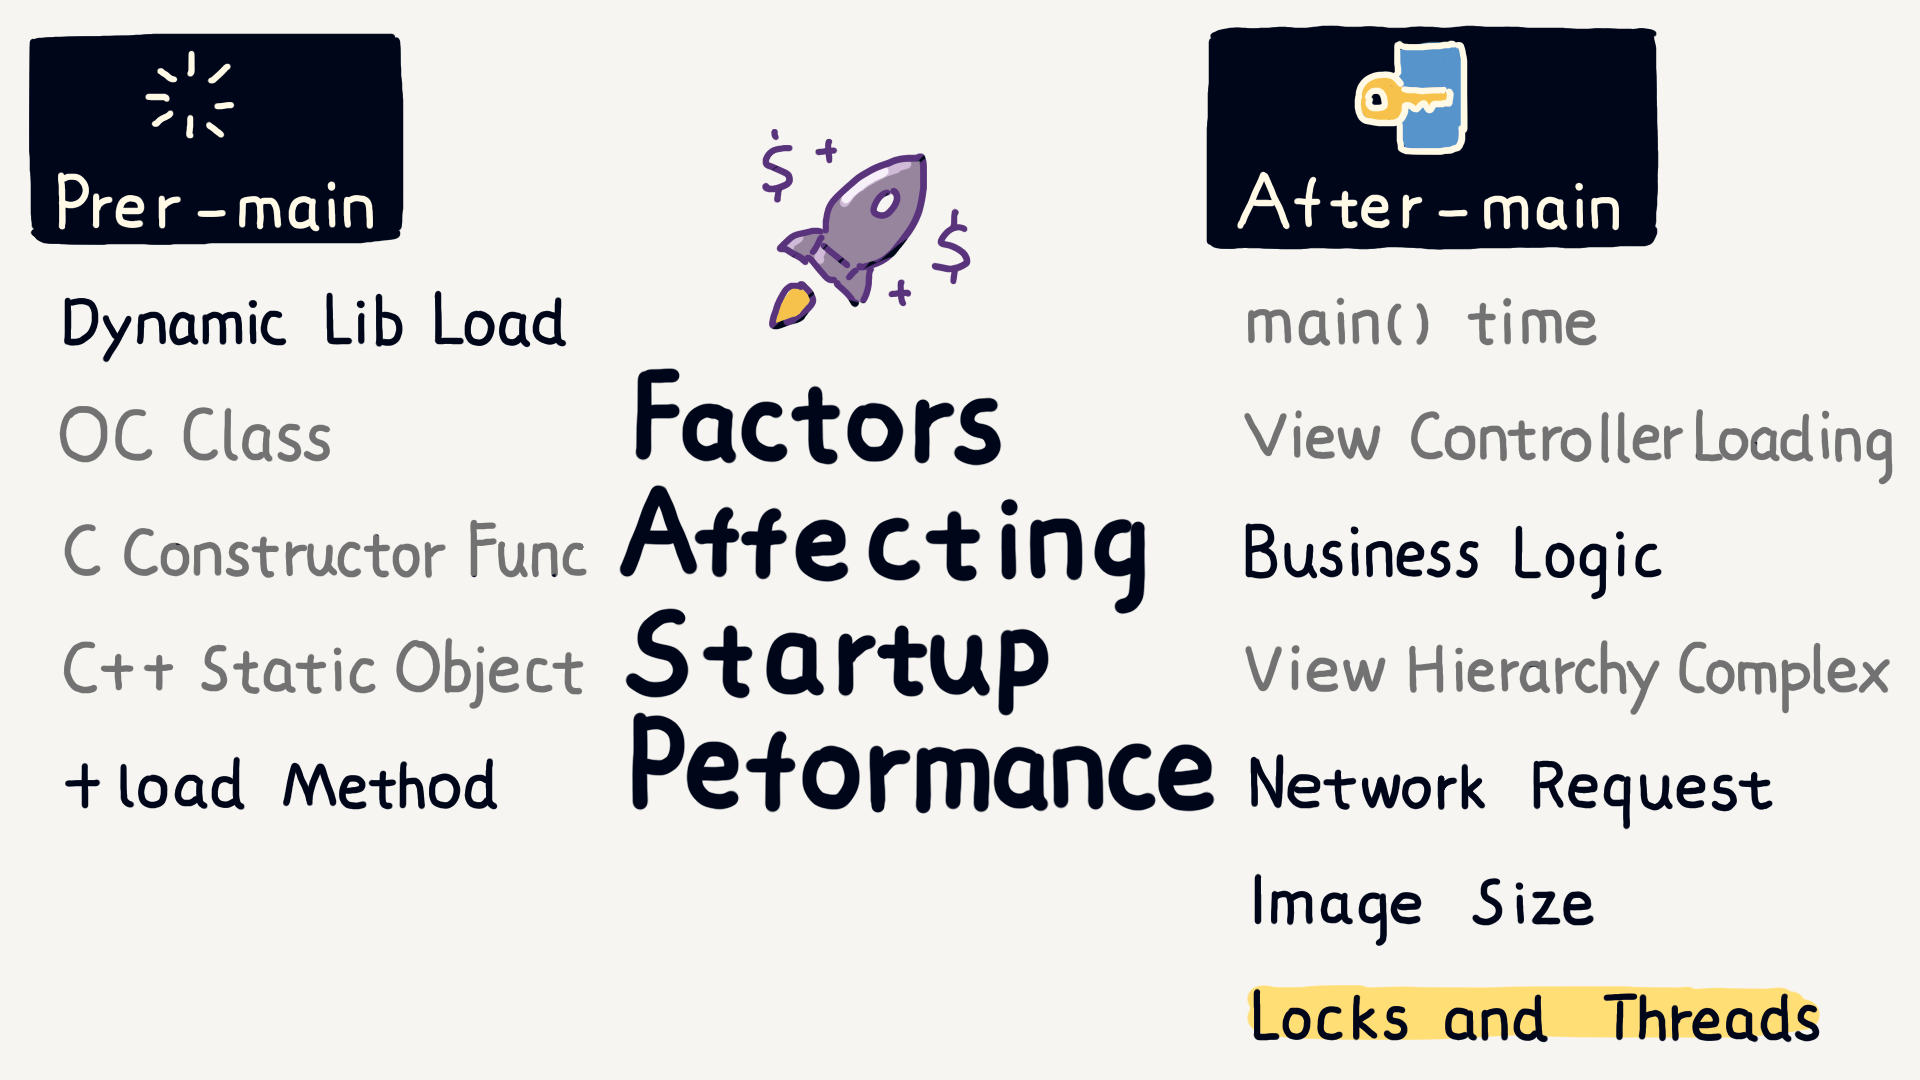
As you can see, many factors influence launch time, both before and after main(). However, this also means there are many opportunities for optimization.
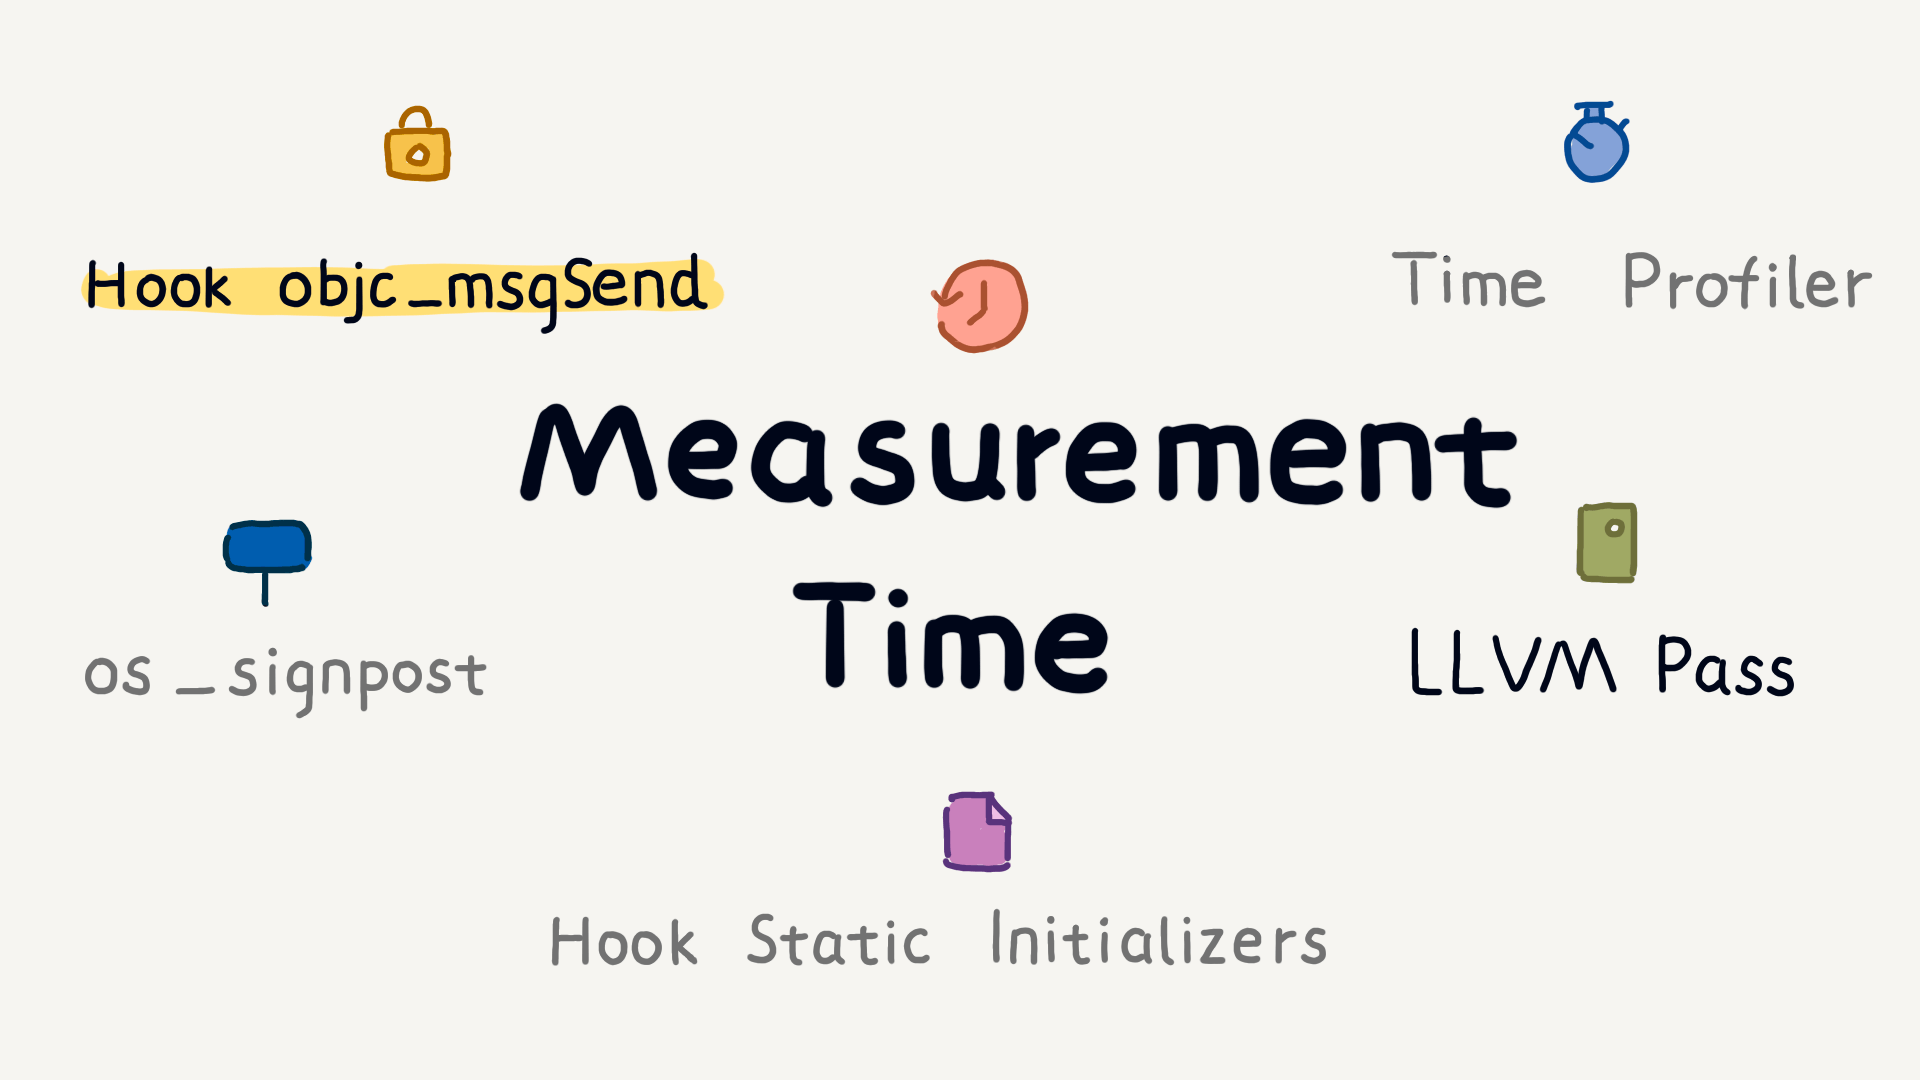
For large apps, which are often developed by multiple teams, tasks executed at startup can change with each iteration. Therefore, we need an effective way to measure the time consumption of each task during startup to identify the “culprits” slowing down the launch, enabling targeted optimizations and checking the effectiveness of those optimizations.
Common measurement tools include Xcode Instruments’ Time Profiler, MetricKit’s os_signpost, hook initializers, hook objc_msgSend, and LLVM Pass.
Next, I’ll focus on hook objc_msgSend, which can record the execution time of each Objective-C method. For measuring the execution time of Swift functions, you can use LLVM Pass, which I’ll explain in detail when we discuss package size optimization.
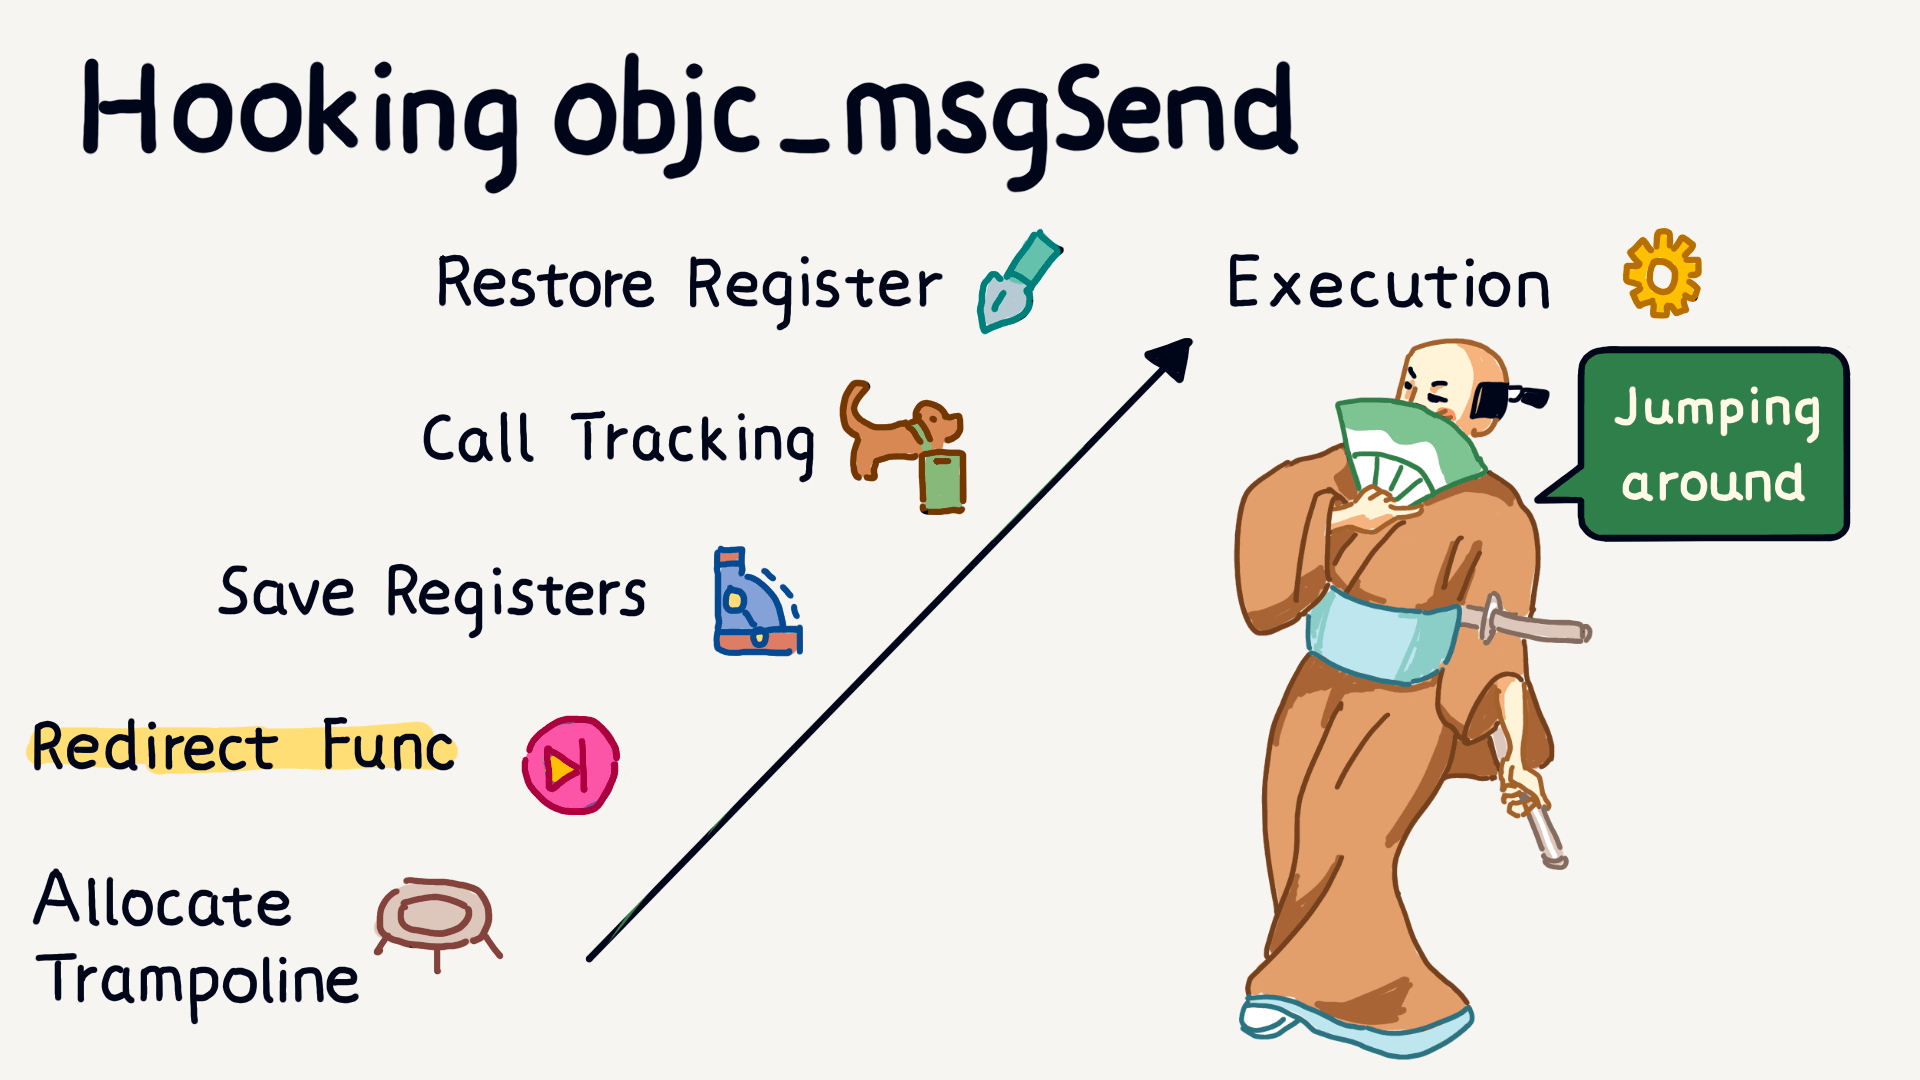
By hooking objc_msgSend, we can record method call information, including method names, class names, and parameters. By inserting tracking code before and after method execution, we can calculate the execution time of each method.
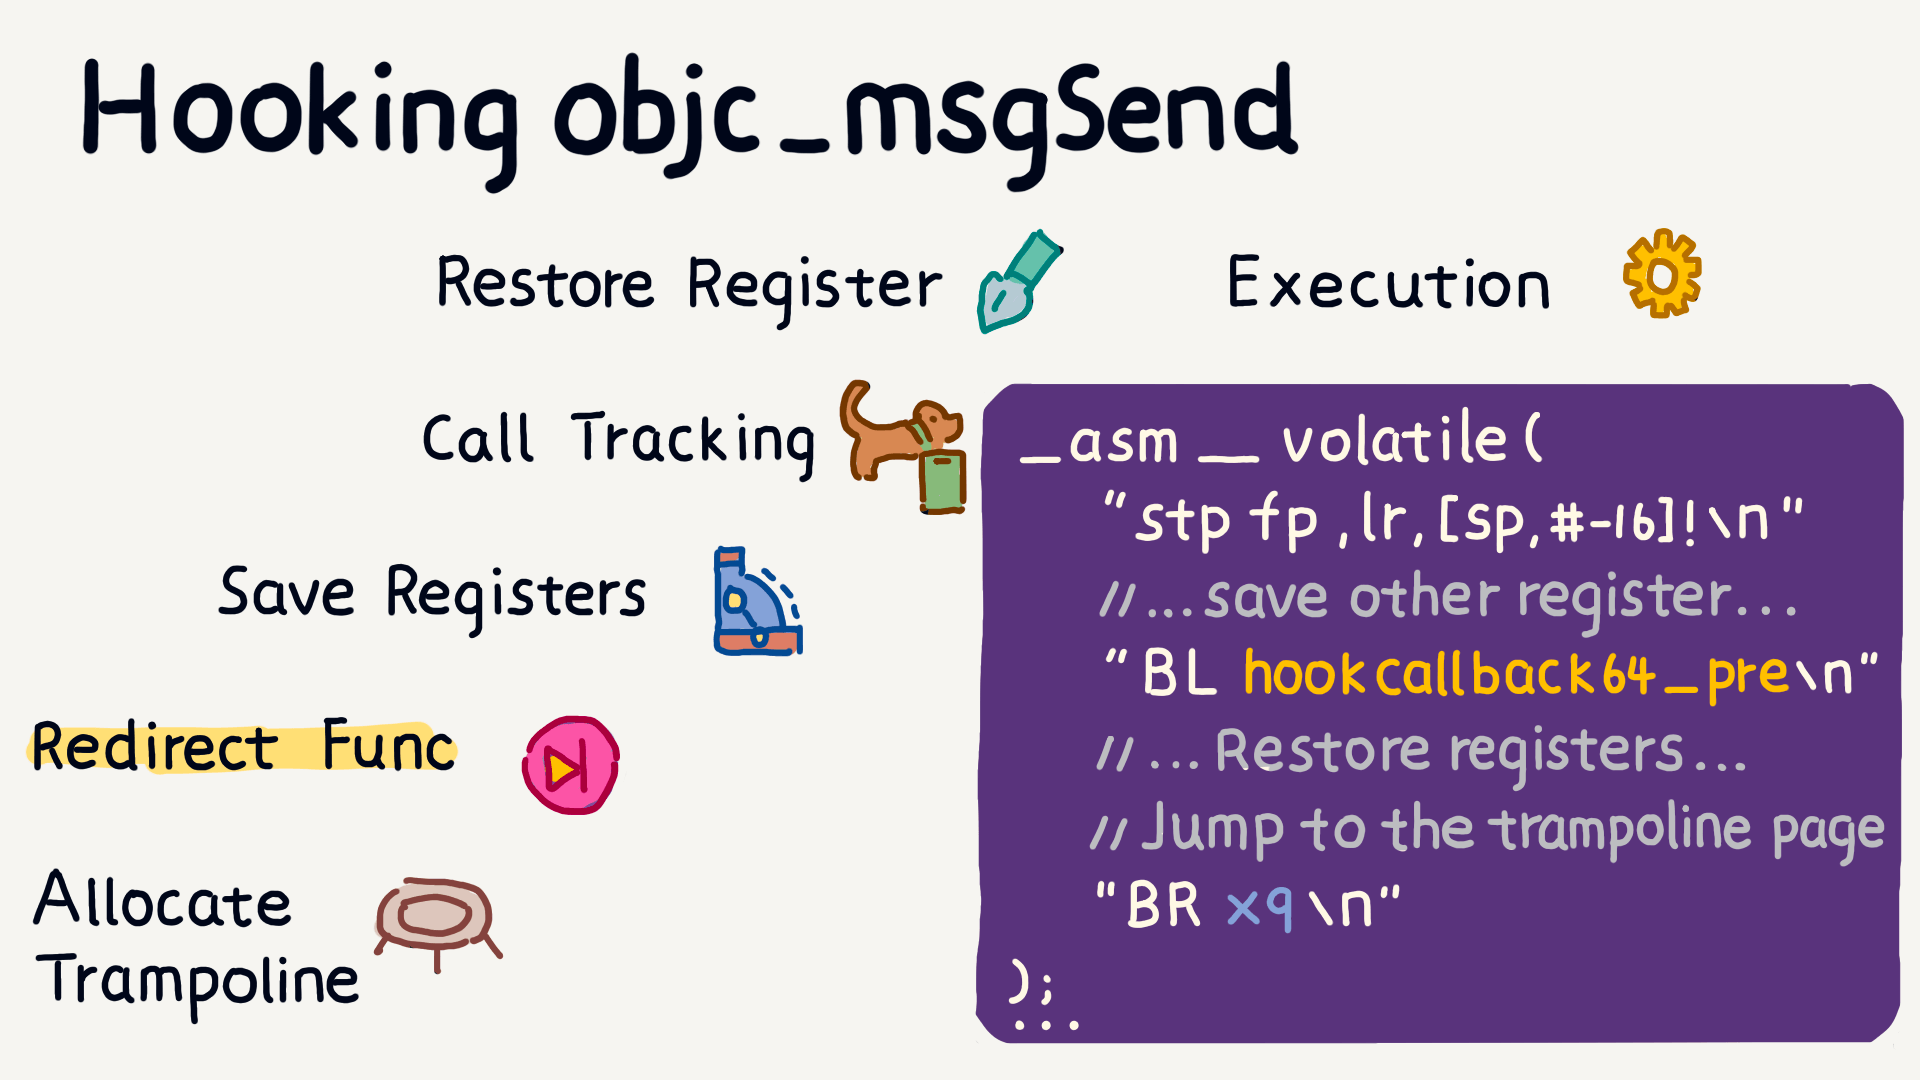
The specific approach is to first allocate memory space for jumping, with the jump function being used to record the time. Then, save the register state: the x0 register can obtain the class name, the x1 register gets the method name, and the x2 to x7 registers can be used to get method parameters.
After completing the jump function call, restore the saved registers and use the br instruction to jump back to the original method and continue execution.
Although hook objc_msgSend uses assembly language, it’s not too complicated to write as long as you understand the roles of several registers and how the instructions work.
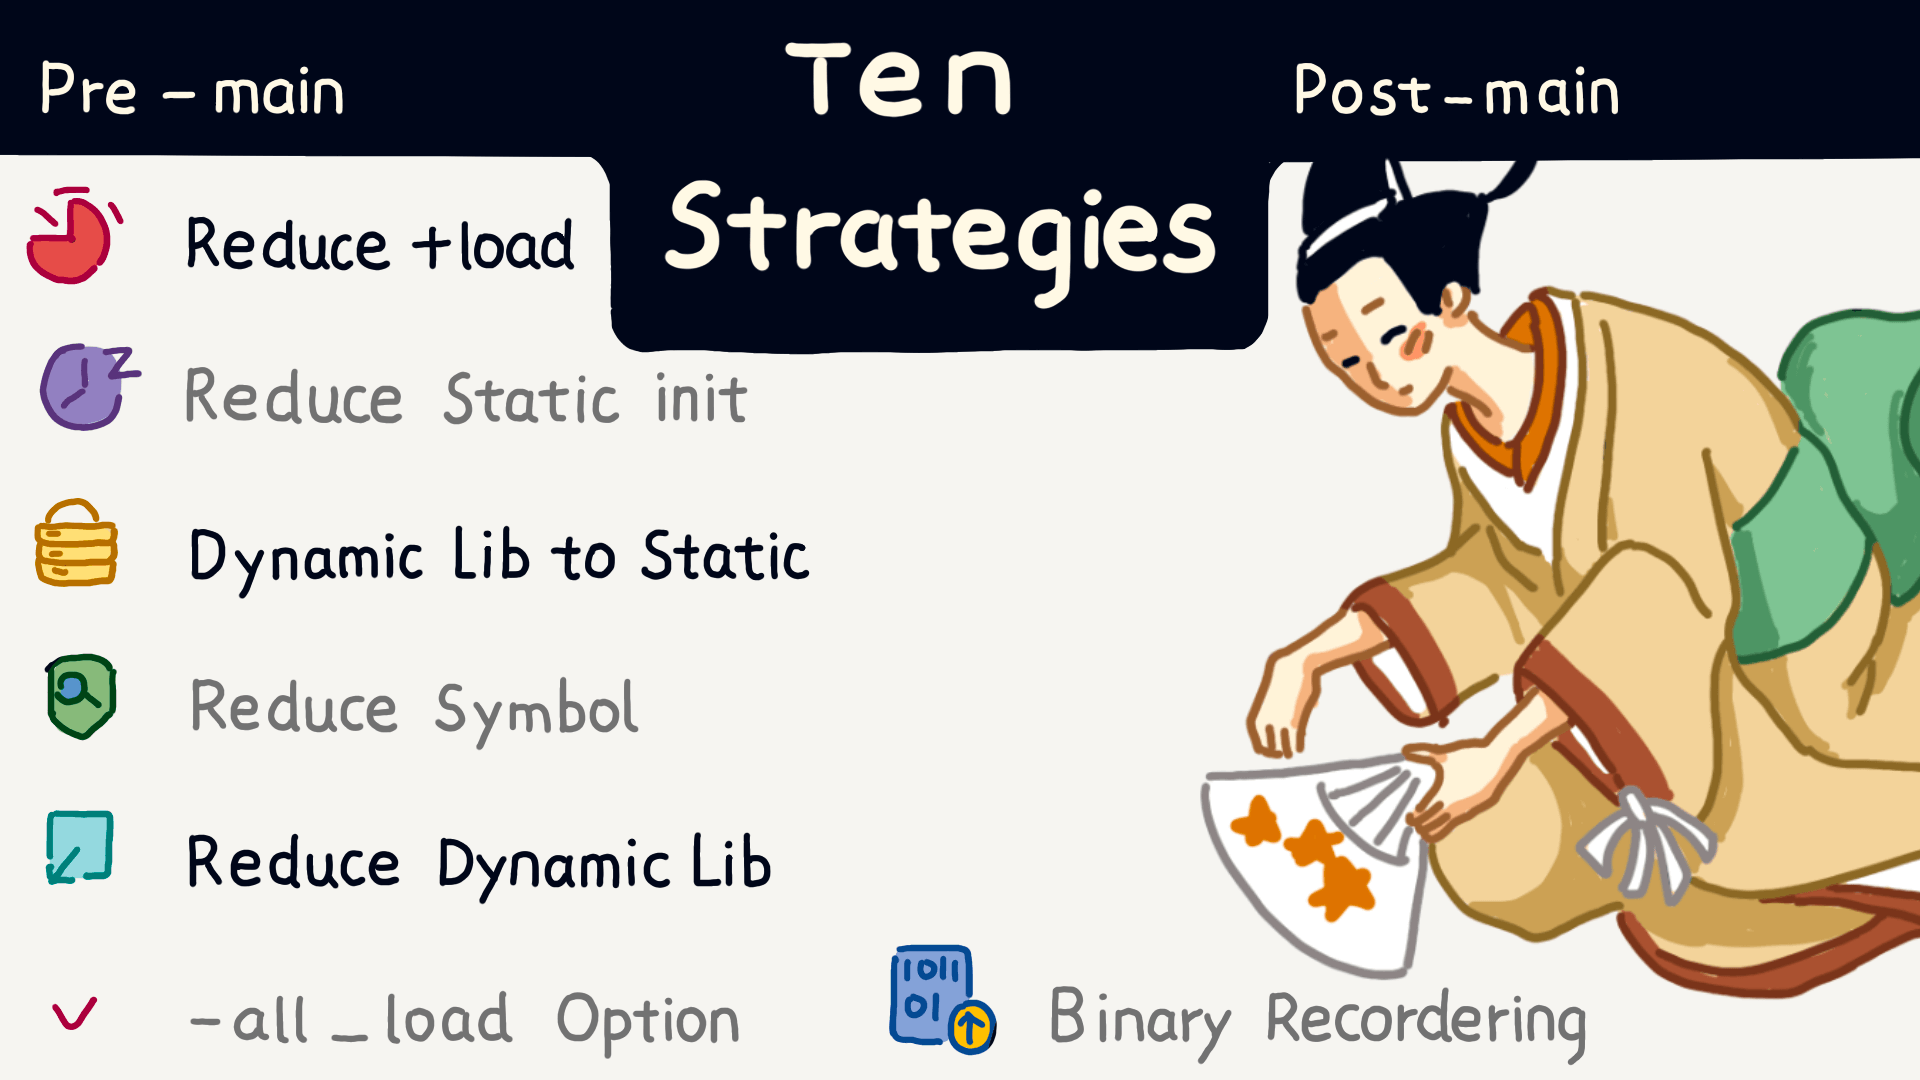
Next, I will introduce ten very useful startup optimization strategies:
- Reduce the use of +load methods.
- Reduce static initialization.
- Prefer static libraries over dynamic libraries to reduce the number of symbols.
- Control the number of dynamic libraries.
- Use the all_load compiler option.
- Perform binary reordering.
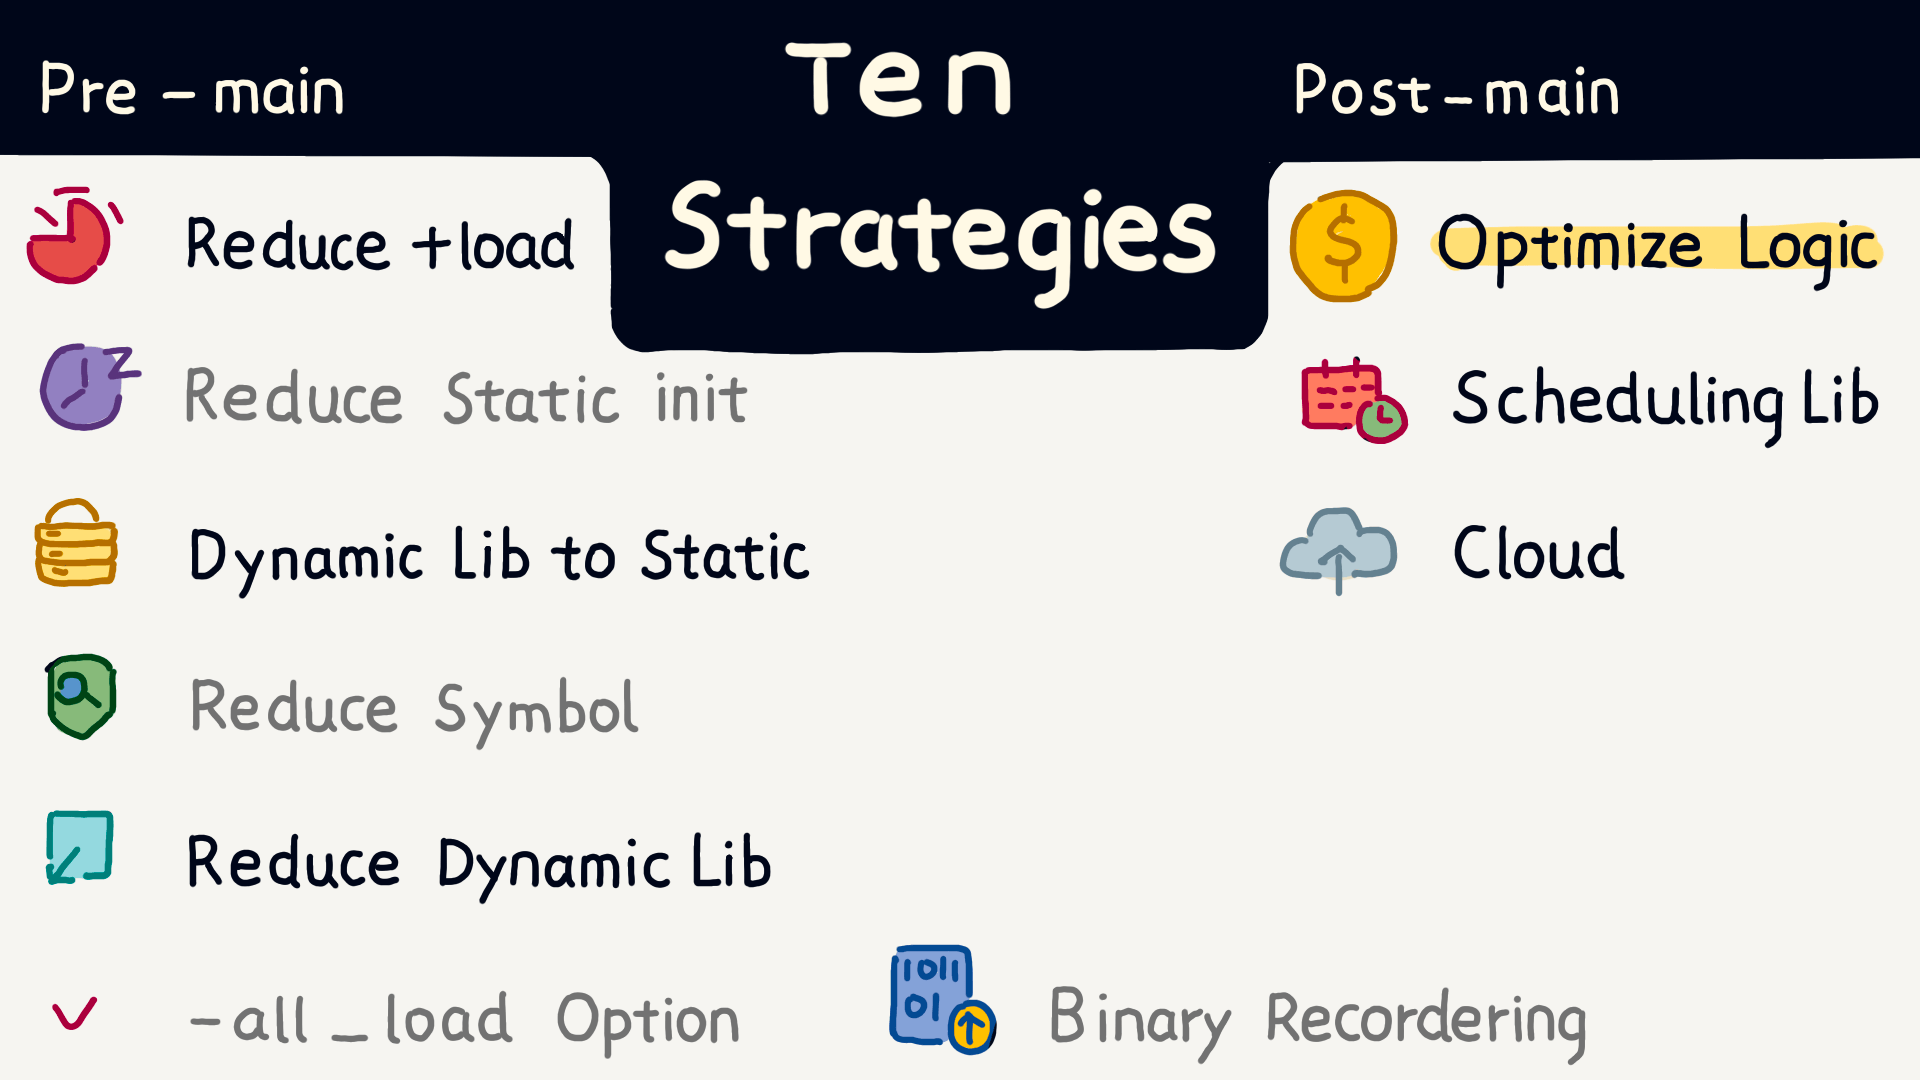
After the main function, we can do a lot more optimization, such as:
- Optimizing business logic.
- Using task scheduling frameworks to arrange tasks more efficiently.
- Leveraging background mechanisms to handle non-essential tasks.
- Refreshing regularly to fetch server data in a timely manner.

The final important topic is optimizing package size.
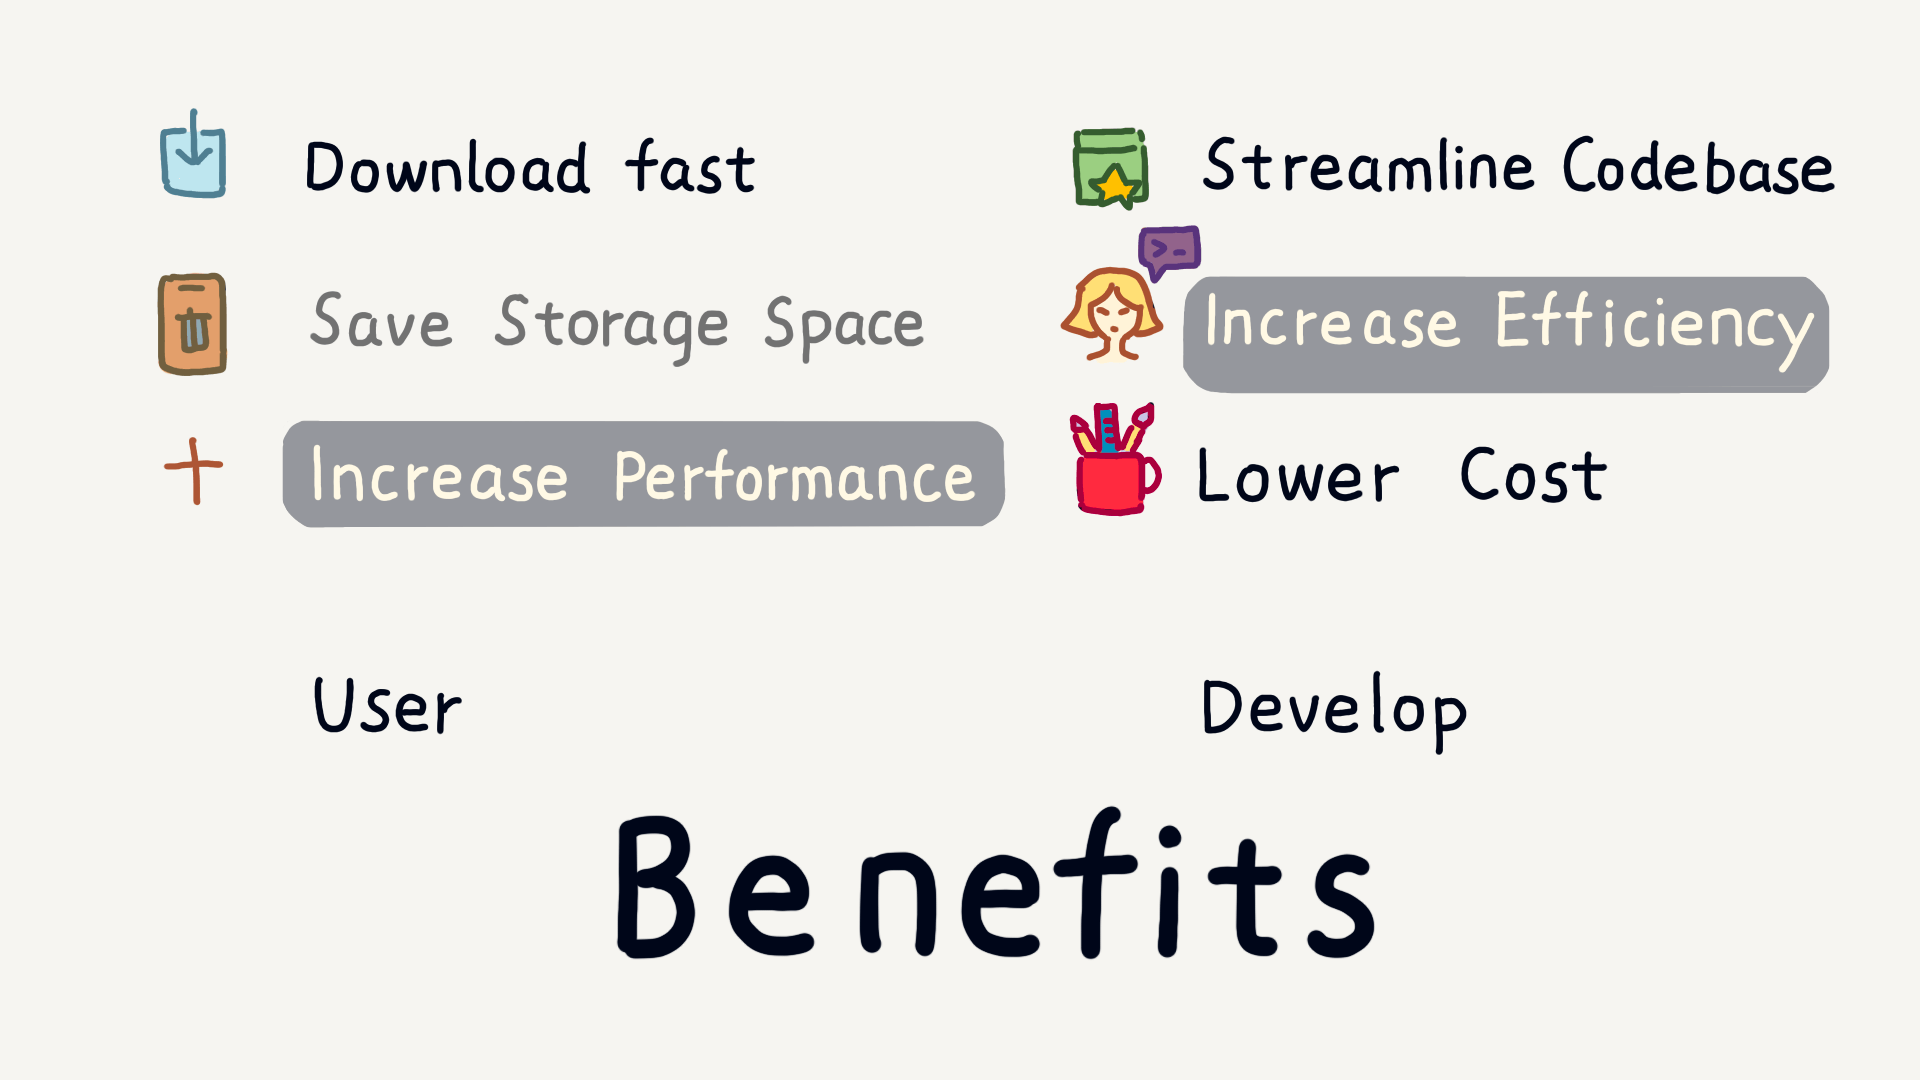
Optimizing package size has many benefits. For users, it improves download speed, saves device storage, and reduces resource consumption. For developers, it lowers development and maintenance costs while improving efficiency.

Through static analysis, we can identify some unused resources and code. Today, I will focus on how to discover unused code at runtime, starting with detecting unused classes.
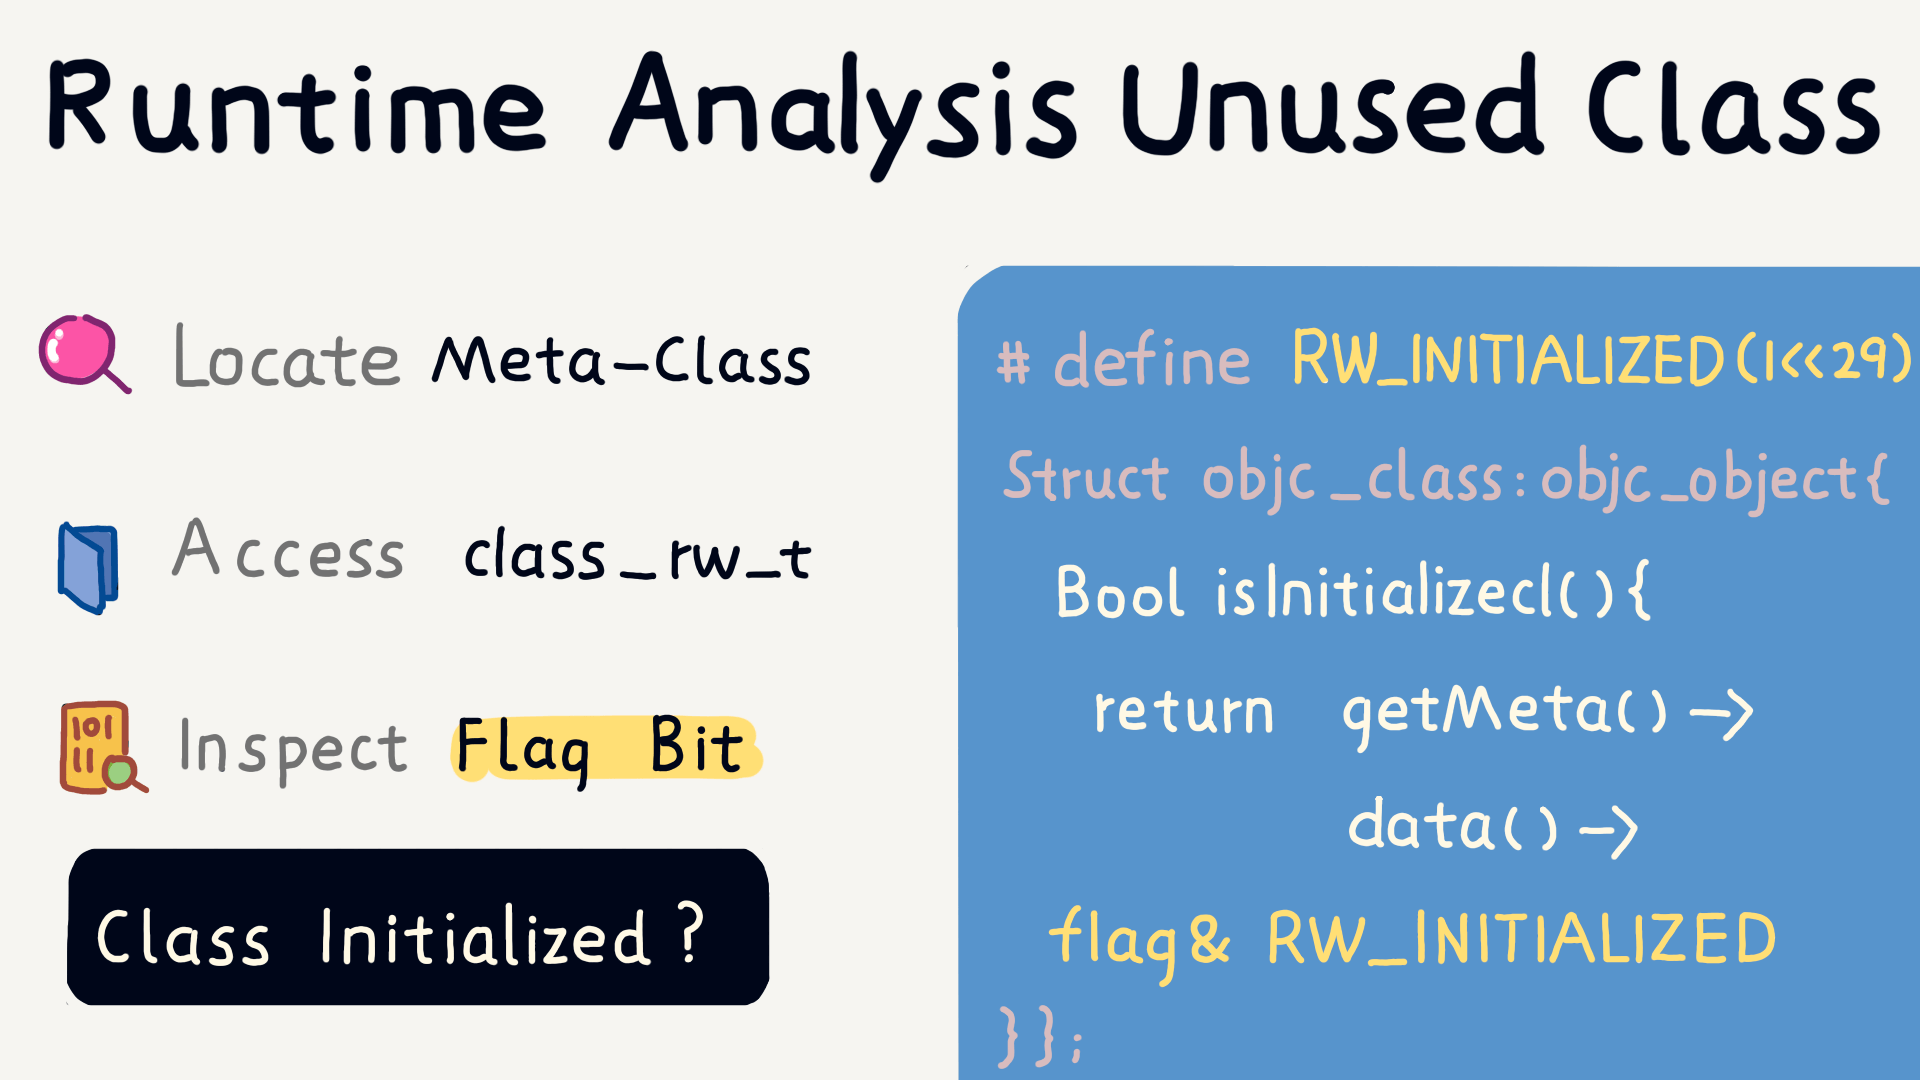
In the meta-class, we can find the class_rw_t structure, which contains a flag that records the state of the class, including whether it has been initialized at runtime.
The code on the right shows how to access this flag and use it to determine whether a class has been initialized.

Next, let’s discuss how to determine which functions haven’t been executed at runtime.
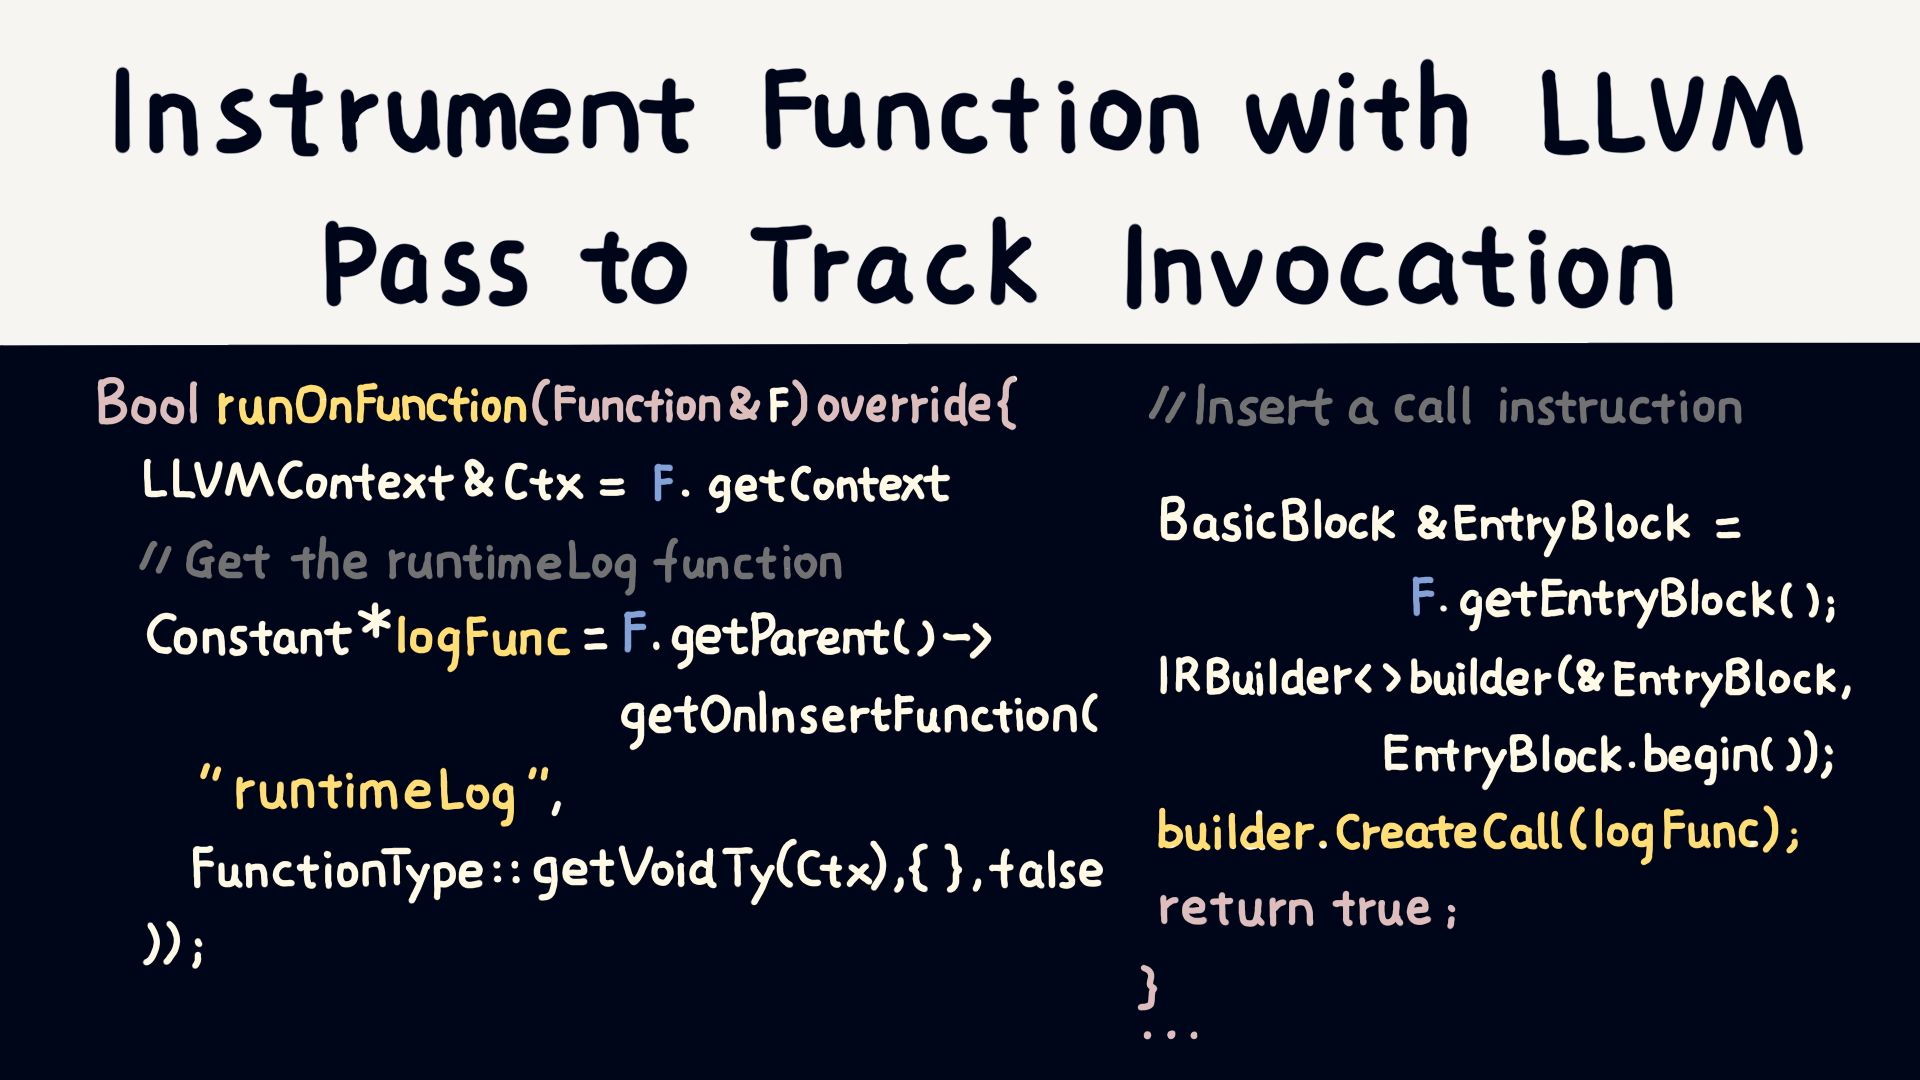
This code shows how to customize an LLVM Pass to instrument each function and track whether they are called. The instrumentation code is written in the runOnFunction or runOnModule functions, where the former handles individual functions, and the latter handles the entire module.
Additionally, LLVM Pass can insert tracking code before and after function execution to record the execution time of each function.

以上就是分享的内容。下面是一些见闻。

KWDC 这次是在一所大学举办的。

这是我、徐驰和 falanke 的合影,会场有个大头照机器,很多人都在这里合影。

iOSConfSG 2025 组织团队负责人 Vina Melody 也来了,我分享结束后跟他们沟通了下明年我去新加坡 iOSConf 分享的内容。
第二天,KWDC团队组织我们在首尔 City walk,第一站是景福宫,我们玩起来 Cosplay。
freddi 是喵神的同事,在福岡。
River 是韩国的一名独立开发者,开发了很有品味的 APP Cherish。她不喜欢 KPOP,但她父母好像是从事表演的。
台湾最知名的 iOS Youtuber Jane 这次也来了。
中午我们吃了鸡肉火锅。
下午去了汉江野餐。晚上我们登上南山,看到了美丽的首尔夜景。
晚上,继续找地方喝酒。韩国晚上街上人依然很多。

和 giginet 聊了点技术问题,他也是喵神的同事。